
What if you could visualize your rental competition on a map? Imagine that you could see how competing vacation rentals are faring on Airbnb: Their occupancy rates, their nightly prices, their yearly revenues, their availability in the coming weeks and much more.
What if, as a real estate investor, you could get this type of information to assess a market opportunity? Would it help you better value houses that have a potential as vacation rentals?
This is what Airdna‘s tool, the Pricing Copilot, does. It offers wonderful dashboards for advanced vacation rental managers who want to maximize their revenues.
I’d like to show you what an unsophisticated vacation rental owner like me can get out of it. Hopefully, it will inspire you and tempt you into playing around with the tool for your own benefit.

Questions about the Bali vacation rental market that I wanted to answer
To make the whole thing a bit clearer, I have created for you a case study for a market that I know a bit: Bali, Indonesia. This is the #1 market for Airbnb in South-East Asia, with plenty of villas for rent, among which 2 of my own.
As a vacation rental owner / property investor, what was I looking into this set of data, as my 2 properties fare very differently one from another on Airbnb. For instance:
- One is getting most of its bookings from Airbnb, while the other has more diversified booking channels.
- Airbnb has introduced a Smart Pricing feature that gives nightly price suggestions. It’s pretty good for one of my properties, but really off for another.
- Who are the competitors, on Airbnb, for my secluded beach rental? I know that my villa near Seminyak has plenty of competition. But further away, up the coast, how are the others doing? How are the rates? What is their occupancy rate?
- What are the general pricing and rental availability patterns in Bali? When I talk with local property managers, they complain that the peak demand during the Summer high season (July / August) has become less pronounced.
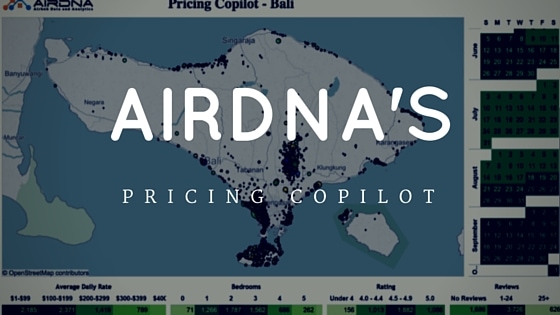
Overview of the Airbnb Bali vacation rental market

This is a general view of the island of Bali, created by Airdna using data from Airbnb.
As a vacation rental owner on the island, I was very interested in seeing where villas were located. It is no secret that most tourists in Bali stay in the Southern part of the island. The Kuta-Seminyak area is very famous for hosting most visitors.
However, I did not anticipate seeing that many villas at the Southernmost tip of the island, the hills of the Bukit.
In the central part of Bali, you can see that the Ubud region offers a lot of villas. Then, you can also find the Amed area in the East, the Lovina region in the North.
- My beach retreat, Bulung Daya, is located on the South-West coast, away from the densest area, but still within a reasonable distance.
- My town villa, Adagian, is drowned in the middle of the densest area of all, the Seminyak – Canggu region.
The Bali market for 3-bedroom villas

Both of my villas are 3-bedrooms, although they differ widely when it comes to location, amenities, and target.
By clicking within the tables along with the map, I can opt to only see the data for the 3-bedroom accommodation. This is the map that you can see right above.
You can for instance the locations for the 1,562 accommodations offering 3 bedrooms. As the 3-bedroom format is very popular on the island, you find some all over Bali.
Zooming in on my Airbnb competitors

Now, this is where the fun begins. I’d like to see how my immediate competition is faring.
My 2 villas are 3-bedrooms, with active listings on Airbnb and very good ratings. I would define a competing active Airbnb listing as an accommodation with at least 1 review and a rating of at least 4.5.
When I click and point with the table, I opt to see only the data for accommodations matching my definition. As you can above, 778 3-bedroom accommodations match my definition on the competing market.
When we look at the table we can get some information about the average daily rate for these accommodations (Here the period is over 4 months, as I have not yet started playing with time periods).
Price-wise, here are the average daily rates that we get:
- 145 listings are between $1 and $99
- 455 listings are between $100 and $199
- 330 listings are between $200 and $299
- 148 listings are between $300 and $399
- 46 listings are between $400 and $499
- 22 listings are between $500 and $599
- 16 listings are above $600
Now, my villa Adagian, which is located in an extremely competitive part of the island, is at $125 per night. My beach retreat, at $595 per night, is an outlier, both geographically and price-wise.
Ranking the most successful Airbnb listings by estimated revenues

The Pricing Copilot gathers all kinds of data for each Airbnb listing, such as average night daily rate (ADR) and occupancy rate.
As a result, Airdna can rank properties according to their respective estimated annual revenues. I had a look at the most successful 3-bedroom properties, as you can see above.
The first one is called “A River Runs Through it“. It’s a wonderful villa, located in the hills of Ubud and created by Hollywood set designer David Seligman.

Number 2 is again an Ubud villa, called Amara. The interiors look nice, no wow view here, but the price is sweet at $243 per night. The photos are “wow, yet the price is not “crazy high”, at $345 per night in a villa with 3 bedrooms that can actually sleep 9.
The 3rd one is a bit weird: It is a waterfront property on Benoa Bay. It is listed at $1,202, which is super high. Yet, I cannot see any review for this property on Airbnb. I am not entirely sure what to think here.
I was expecting some Seminyak villas to be at the top, this is an interesting surprise.
Pricing patterns in the high season (Summer)

Just below the map for my competing market, I get from Airdna this graph which shows 2 things:
- In orange, the number of available listings for a specific date. For instance, more than 600 in early October.
- In blue, the night rate for the available accommodations. For instance, it reaches around $240 in July and August.
Now, price-wise, you can see that most vacation rental owners and managers tend to raise their prices between July 1 and August 31. This is a peak season, where a lot of European travel to Bali, for instance.
What is very interesting to me is the availability graph. First, you can see that July already has a low availability, compared with June or September.
However, after August 10, availability is rising back up really fast. At the same time, average night prices tend to be the same as in July.
Now, it is only early April when I am writing this down, so visitors may have not fully booked their August stays yet. However, this could also mean that the peak season is really between July 1 and August 10, so prices should start falling back down much earlier than September 1.
This is interesting to me too, as local property managers had been telling me that “Summer had become shorter” and I can sort of see it here. But I am not a great expert at reading this kind of data, so maybe I am getting it wrong.
Closer look at the competitive environment for my Adagian villa

My Villa Adagian is a wonderful villa for a family who wants to be close to the action (e.g. trendy restaurants in Seminyak), yet to be sleeping in a quiet area that easily leads to the North of the island.
I drew a map to try to get a better picture of the competitive market around my villa Adagian. There are still 470 3-bedroom accommodations, in this area, with at least 1 positive review and a rating of 4.5+.
To me, it means that Airbnb’s automatic pricing feature (“Smart Pricing”) must have plenty of relevant data on the market. There must be way enough data points for Airbnb to accurately predict demand and pricing for my villa Adagian. So, I chose to turn the Smart Pricing feature on for Adagian.
Closer look at the competitive environment for my Bulung Daya beach retreat

Bulung Daya is my beach retreat located on a wild black sand beach. It is the only building on this beach, lost between the sea and the rolling rice paddies.
You could argue that the competitive market is any luxury retreat in Bali. However, I think that a beach location is very different from being located in the hills of Ubud. And people staying in the East of Bali are going after diving spots, not so much on this side of the island.
The amenities of the house, from the private gym, the 33 meters long pool, the private chef, the theater room, etc. make it an outlier as well.
Over the last 2 years, a couple of competing villas have popped up in the Balian beach area, and I still wanted to have a look at the data.
Overall, there are only 12 3-bedroom villas competing with us on this coast. Some are right on the beach, some not. Some are luxurious, others are souped-up surfer shacks.
So, this can explain why Airbnb’s Smart Pricing feature gives me very inaccurate price indications. There are probably not enough relevant data points for it to be working properly for this specific property.
For the moment, I have turned off Airbnb’s Smart Pricing for Bulung Daya.
Conclusion
Sophisticated tool for sophisticated users
Airdna’s Pricing Copilot offers wonderful dashboards for advanced vacation rental managers who want to maximize their revenues.
In this short article, I’ve probably used 10% of what this tool can bring to a savvy user. You can go to airdna.co to ask for your own demo.
Thibault Masson is a leading expert in vacation rental revenue management and dynamic pricing strategies. As Head of Product Marketing at PriceLabs and founder of Rental Scale-Up, Thibault empowers hosts and property managers with actionable insights and data-driven solutions. With over a decade managing luxury rentals in Bali and St. Barths, he is a sought-after industry speaker and prolific content creator, making complex topics simple for global audiences.