Airbnb has launched a new version of its Performance tab. Not only have some names and charts changed, but Airbnb has also introduced an enhanced Quality reporting dashboard, with cleanliness as 1 of the 7 factors that guests can rate. This new performance report is an excellent way for Airbnb management companies to deep dive into the performance metrics of their properties. They can find out which listings and locations earn more than the others, which properties are attracting the most bookings for the coming months and compare results across time and against similar listings.
How to track my Airbnb performance? There is an Analytics tab for that.
Airbnb’s revamped Performance will be exciting to you if you manage a portfolio of properties and if you get a lot of reservations through Airbnb. Some of you may already have an analytics report available through your property management system (PMS) but have a look here where you have all the metrics offered by Airbnb.
The change is not just about new metrics, but also about new ways to create comparisons: Across locations, over time, forward-looking (pace reports), against similar listings, etc. This performance tab can help you answer questions such a:
- What is the average occupancy rate of my Airbnb listings in city A vs. city B? How has it changed over time?
- How many bookings have my 1-bedroom listings received in the last 30 days? How many reservations have they already logged for the next 30 days?
- When guests leave a review, which part of my vacation rental market gets the highest mark on the Location factor?
- If I have hired a new cleaning company at some of my properties, can I see an improvement in the cleaning metric over time?
- How do you earn a top-quality rating on Airbnb?
How to access your Airbnb Quality Performance Report?
First, you need to have turned on our professional hosting tools. The only requirement is to manage more than one listing on Airbnb. If you manage more than 6 listings, the professional hosting tools will become available automatically, but if you manage between 2 and 5 listings, then you’ll need to opt-in manually. To opt-in, simply go to your Airbnb host account settings and click “use professional tools.
If you need more information on how to do so and about each of Airbnb’s pro tools, you may want to read our related articles:
- Airbnb Professional Hosting Tools: What Property Managers Need To Know
- How To Set Up And Maximize Your Airbnb Pro Marketing Page
- “Are You A Private Or A Business Host?” Asks Airbnb
The new set of Airbnb Performance metrics and KPIs for the ProHost
Once this is done, go to your Hosting Dashboard and navigate to the Performance tab. You will find that Airbnb has modified this Performance, in both content and design. In April 2019, when the Performance report launched, it looked like that:
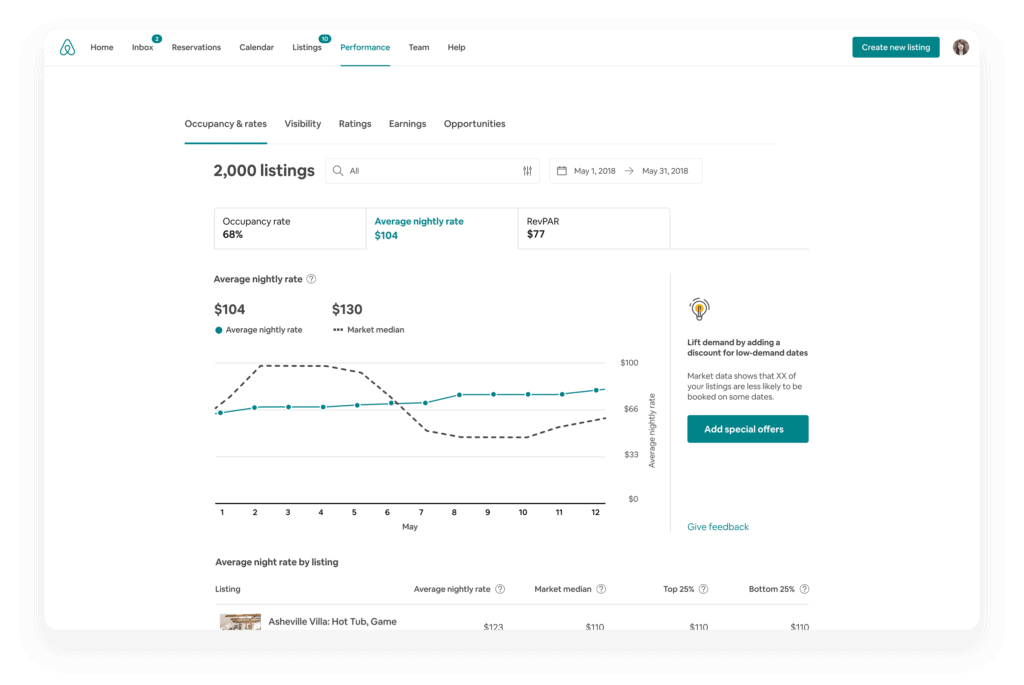
In June 2020, the revamped Airbnb Performance tab looks like this:

So, what metrics do hosts get to look at in the Airbnb performance dashboard?
- Reviews become Quality. This report carries 7 sub-metrics linked to guest reviews:
- Accuracy
- Amenities
- Check-in
- Cleanliness
- Communication
- Location
- Value
- Occupancy & Rates display 4 revenue management sub-metrics:
- Occupancy rate
- Cancellation rate
- Length of stay
- Nightly rate
- Visibility becomes Conversion. This report carries 2 sub-metrics:
- Booking conversion
- Booking lead time
- Returning guests
- Wishlist additions
- Earnings have only one dimension ($$$$) but with sub-items such as money made from cleaning fees
- Opportunities become Progress and show how you are doing on the following programs:
- Basic requirements
- Superhost
- Experience host
- Note that the Work and Family collections have been retired since November 2019.
Slice and dice your Performance Metrics (past, present, and future) with the new airbnb data analytics
Metrics are the numbers you track, and analytics implies analyses and decision making. To help you carry this out, Airbnb has improved the ways you can compare your listings.
airbnb host analytics by time
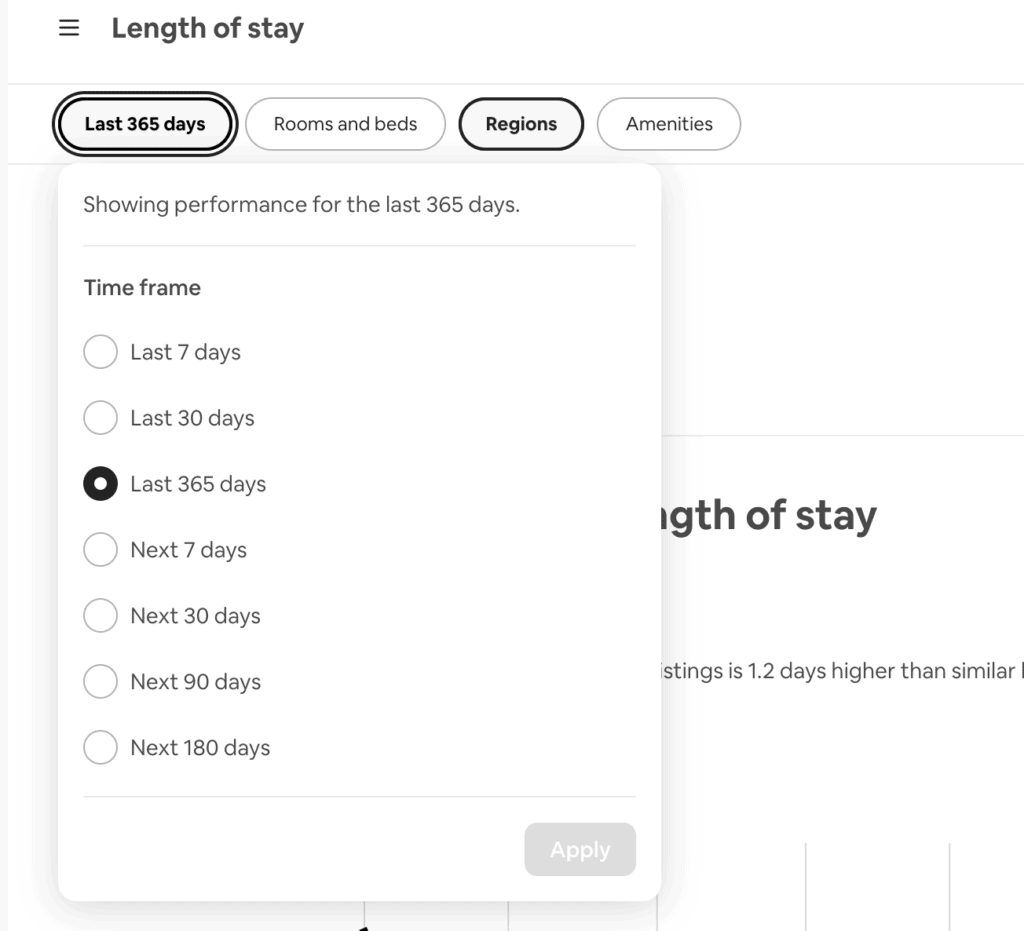
Historical data (past reports): You can change the time frame of the data shown in each section by selecting a time frame. The default view is Last year, and you can also select from Last week and Last month to view historical data. This will show you data from the past 7, 30, or 365 days.
Future data (pacing reports): To view future performance for some data, you can select Next week, Next month, Next 3 months, and Next 6 months. This will show you data for the next 7, 30, 90, and 180 days. Data will be up to date within 24 hours.
airbnb host analytics by region
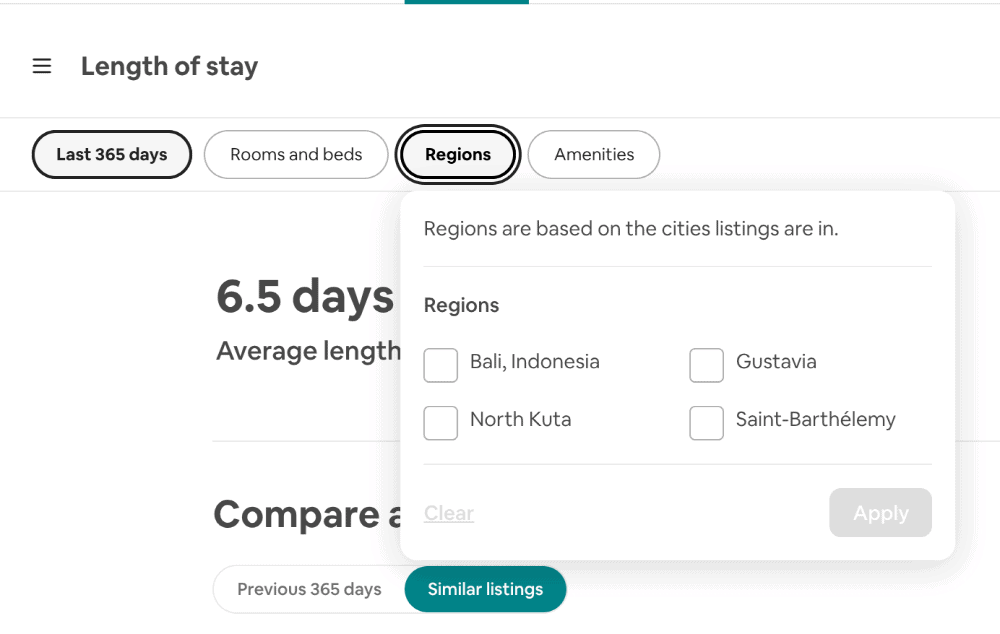
If you have listings in more than one region, city, or country, you can choose to display data for all regions or only those you select.
Slice and Dice your Performance data
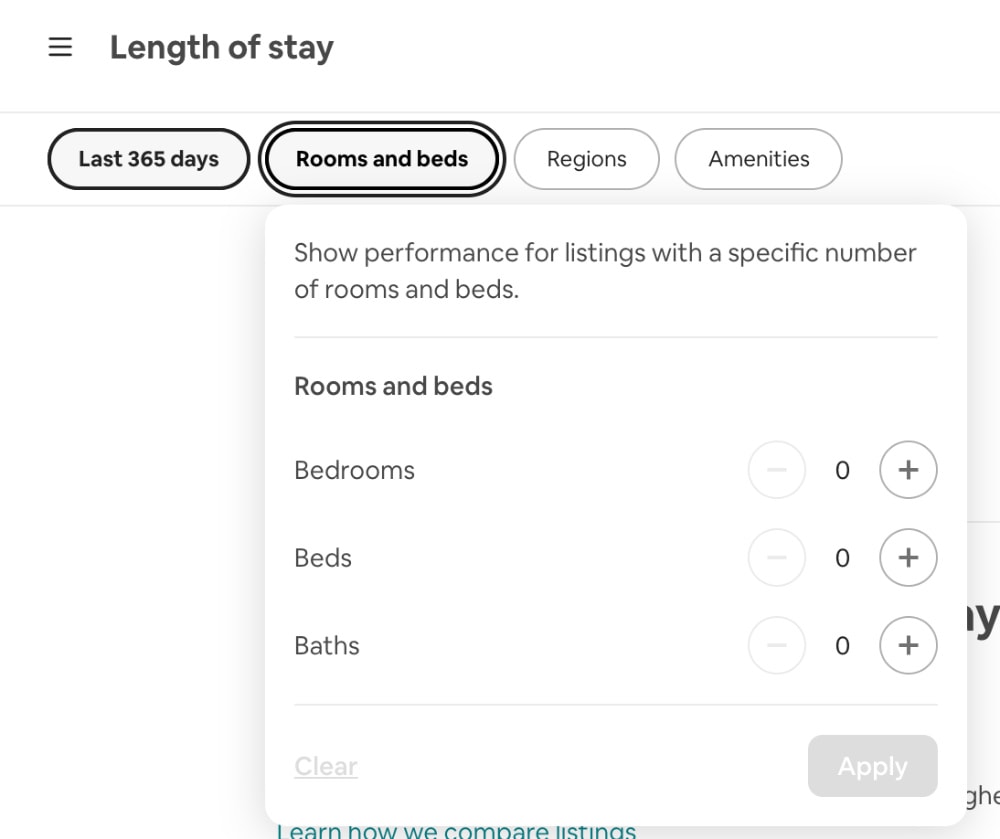
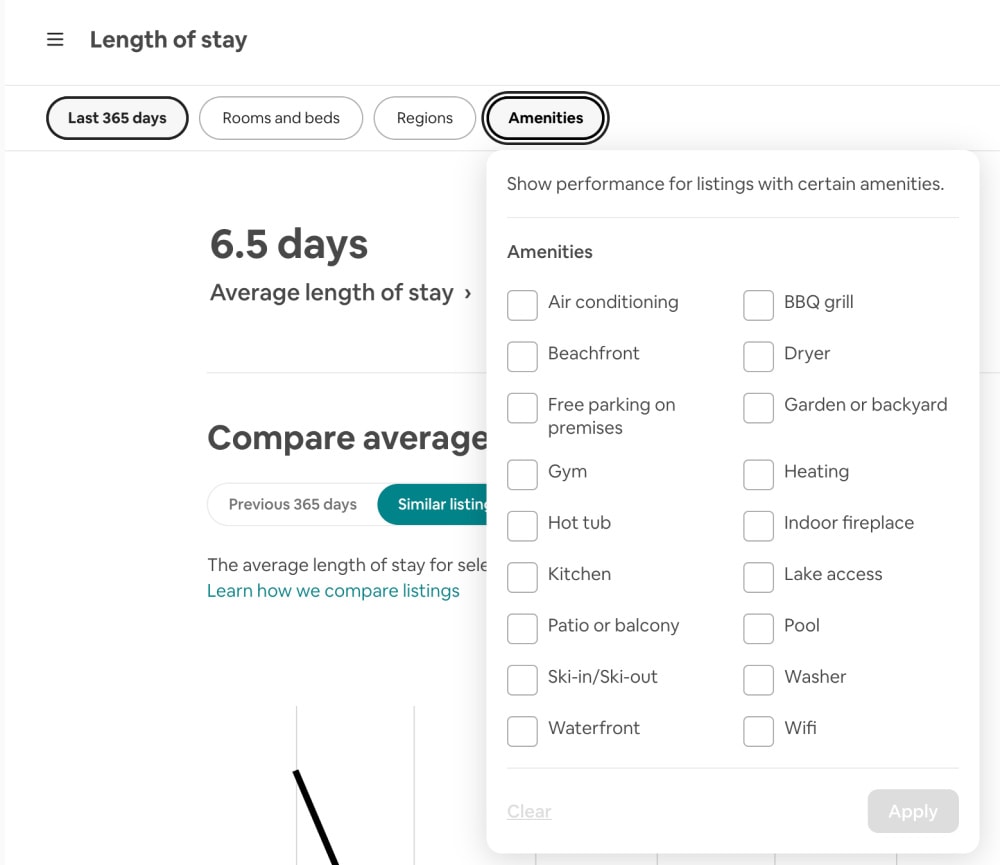
You can then refine your comparisons by only showing the data for your 3-bedroom properties or those with a hot tub. It may bring you some insights on whether some amenities bring more revenues than others, for instance.
Conclusion: The more properties, the better
The more properties you have in your portfolio and the more properties there are in your region, the more interesting the comparisons that you can make.
The forward-looking data have a lot of value in times of sudden change in an area, and when historical data do not allow to predict future patterns anymore.
