The advent of short-term rental platforms such as Airbnb and Vrbo has redefined property investments’ financial utility. By matching hosts and travelers, short-term platforms have created an entire industry within the sharing economy, one that rivals hotels with its uniqueness and affordability. As a result, vacation rental properties have become low-risk investments with high-income earning potential. Here, we are comparing Mashvisor vs Airdna.
If you are on the look-out for your next (or first) property investment, you need reliable data that will help you make an informed investment decision. Having a thorough understanding of the market, as well as the major drivers that affect rates and property prices are a must, as it will help you choose the optimal vacation rental property that will yield the highest occupancy and daily rates. In this article, we present Mashvisor and Airdna – the two industry-leading solutions that can help you make an informed investment decision.
Property investment: Stacking the odds in your favor
A growing number of people prefer the experience of vacation rentals to that of hotels. Travelers are drawn to unique spaces available through short-term platforms such as Airbnb and the freedom this accommodation type offers. In addition to that, short-term rentals are commonly available in areas often not served by hotels that cater to the needs of a novel generation of travelers.
Airbnb’s increasing popularity among vacation goers and the high demand for stays in vacation rentals have significantly boosted short-term rental investment properties’ earning potential. In fact, properties listed on Airbnb that attain solid occupancy rates are often more profitable compared to similar properties on the long-term rental market.
Investing in an Airbnb rental comes with other advantages as well. For one, investors don’t have to deal with tenant-screening, which can be a tedious task, and they don’t have to search for long-term tenants in order to secure a steady cash flow. Most importantly – investors don’t have to deal with evictions.
Short-term rental platforms like Airbnb simplify and automate most of the tasks around the renting out of short-term rentals. This makes investing in short-term rentals (Airbnb) more advantageous and increases profitability. However, to maximize earnings, investors must invest in the right market and property type.
Mashvisor and Airdna are industry-leading solutions that can help you do exactly that.
What is Mashvisor?
Mashvisor is a powerful tool that can be used to discover properties to invest in. Mashvisor helps investors pinpoint properties that can yield high returns in the long-term or short-term rental property market.
Mashvisor: Product overview and key features
As an online solution designed to help real estate investors make better decisions, Mashvisor focuses on providing real estate data and the appropriate tools to analyze it. Overall, Mashvisor can help investors to:
- Optimize their rental income strategy;
- Understand the specifics of markets and follow developments;
- Find property investment opportunities.
Mashvisor utilizes a vast pool of in-depth data about the property and rental markets and a number of integrated tools to analyze and present the data as useful and actionable information. These are Mashvisor’s most important features:
- Property Finder,
- Rent Analysis,
- Insights,
- Purchase Analysis,
- Reports,
- Property Marketplace,
- Heat map,
- Property Calculator.
Property Finder
This feature allows users to rank properties according to user-defined criteria and list the best ones first. Some useful indicators offered by Mashvisor include cash on cash return, cap rate, occupancy rate, rental income, and listing price. Investors can further focus their research on more specific criteria such as market availability, listing price, return on investment, optimal rental strategy, and property time.
Numerous filters and research possibilities ensure that investors can always find the property they are looking for, even in multiple cities, as Mashvisor offers functionality to search in more than one city simultaneously. Users can choose up to 5 cities, and with the assistance of AI, Mashvisor will list the best performing properties across the selected cities.
Rent Analysis
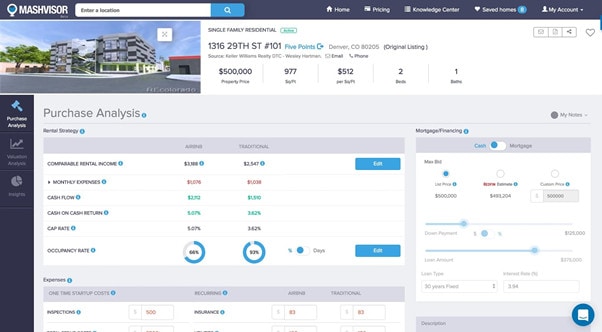
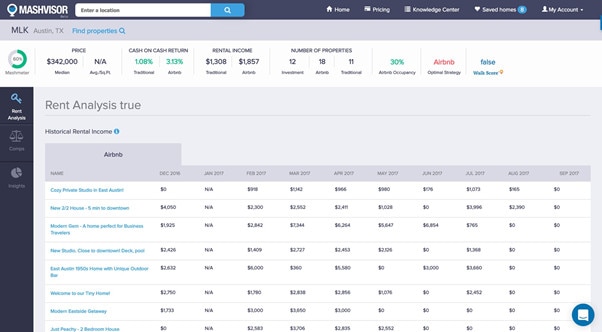
The rent analysis feature enables investors to visualize the income potential of a property. Mashvisor estimates the future returns of investment properties by projecting monthly rental income and occupancy rate, which can be forecasted for traditional or short-term renting scenarios. Predictions are based on the actual performance of rental properties in the same area. On top of that, Mashvisor can forecast the cash on cash return for individual investment properties and a cap rate for traditional or short term renting scenarios.
Purchase Insights and Analysis
The Mashvisor-calculated score of the overall investment potential of a property is a feature built upon the use of machine-learning algorithms and data analytics. It combines the property’s and neighborhood’s characteristics, comparable sales, rental comps, and market trends. Their calculator is able to immediately recalculate the estimated cash flow, cash on cash return, and cap rate based on your knowledge of the market.
Property Marketplace and Reports
This functionality provides searching for investment properties for sale in the US markets. There are different filters that you can tailor to your investment needs and return expectations. Property price, traditional and Airbnb rental income, and cash on cash return for neighborhoods in every US market are the central investment metrics provided by this feature.
Heat Map
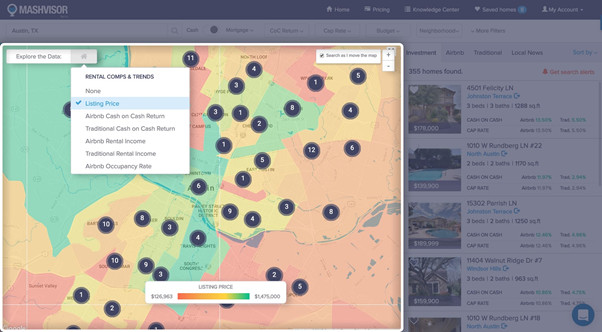
Mashvisor also includes color-coded city maps where you can map the neighborhoods with low and high listing prices, traditional and Airbnb rental income, traditional and Airbnb cash on cash return, as well as the Airbnb occupancy rate.
What is AirDNA?
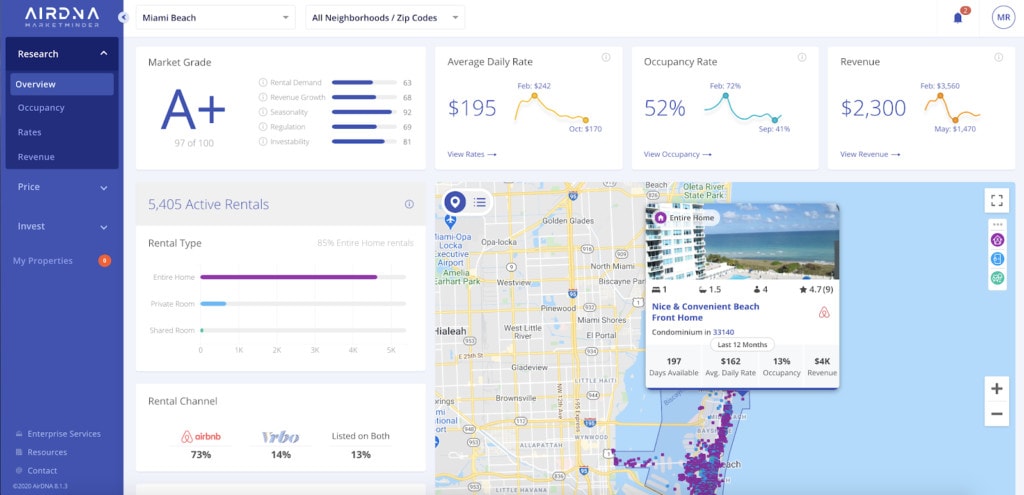
A leading source of vacation rental data, AirDNA offers a wide range of tools to help its users find profitable investment properties. It offers competitive insights, custom reporting, and interactive dashboards covering more than 10 million rentals across 120,000 markets worldwide. It provides an opportunity for vacation rental investors to understand and analyze key trends in the short-term rental industry leveraging historical and future-looking data to maximize revenue potential.
MarketMinder: Product overview and key features
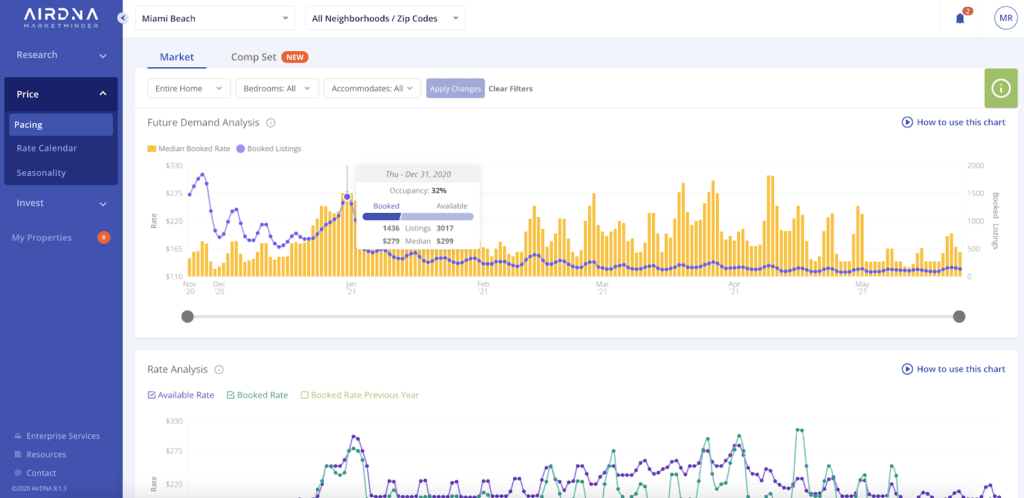
As a solution designed to get useful information on the performance of vast amounts of rentals and examine how the short-term rental industry is changing, MarketMinder helps potential investors understand how their vacation rentals are performing compared to others and to study real-time future demand to set their prices.
MarketMinder can help investors to:
- Locate investment opportunities;
- Compare future demand with nearby comps;
- Price smartly and accurately;
- Grow portfolio with profitable listings
Market Comparison
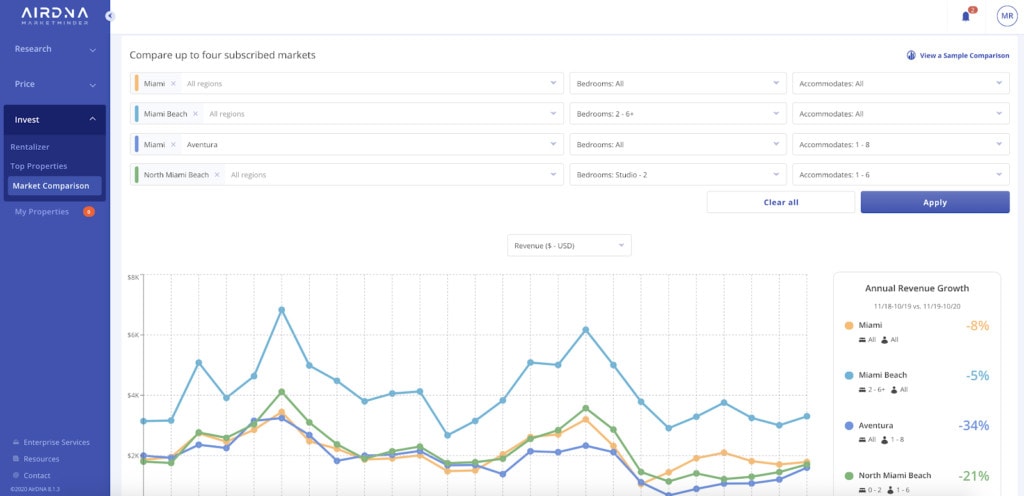
The Market Comparison tool in MarketMinder allows Airbnb investors to compare cities, neighborhoods, and zip codes with the number of bedrooms and guests it can accommodate. Investors and second-home buyers can analyze annual revenue, ADR, and occupancy trends over the past years to find the most profitable properties.
Calculate Revenue Potential & Cap Rate
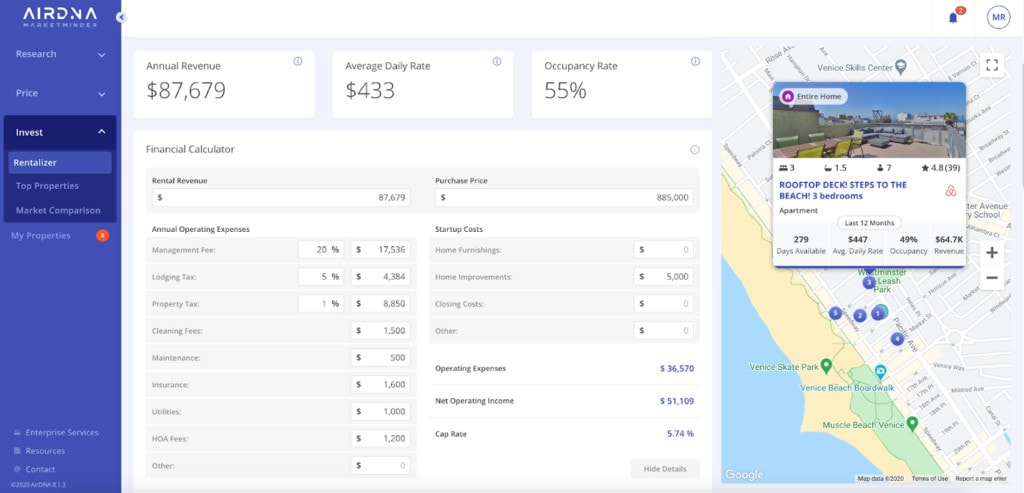
Rentalizer, the Airbnb Financial Calculator, allows you to enter any address in the world and immediately receive projections on revenue, occupancy, ADR and nearby comps. By customizing your bedroom count, purchase price and major expenses, you can also receive operating income figures and cap rate to guide your investment decision.
These are MarketMinder’s most important features:
- Short-Term Rental Research feature with interactive maps
- Data-Driven Dynamic Pricing
- Customized Comp Sets
- Forward-Looking Airbnb Data
- Market Comparison
- Calculate Revenue Potential & Cap Rate
Short-Term Rental Research
This feature is handy for gaining competitive insights on Airbnb and Vrbo rental properties. You can use interactive maps to examine how some neighborhoods and vacation rental properties perform. The feature includes over 25 crucial performance metrics: average daily rate, occupancy, rental revenue, booking lead times, active listing, etc.
Data-Driven Dynamic Pricing
With this feature, one might compare market rates to recommended rates based on property performance to have the most personalized dynamic pricing recommendations. Among the questions that could be answered are: “at what particular hours guests are willing to pay a premium?”, “how probable is it to be booked last minute?”, or “what type of events are increasing rates in your area?”.
Customized Comp Sets
MarketMinder also allows you to upload your property and connect your listings. One can leverage the dataset to curate an accurate list of nearby akin listings. The feature provides sorting and filtering the competitive set according to ARD, occupancy rate, amenities, revenue, distance, experience, and quality. Hosts can compare pricing, demand, and historical insights to their competitors.
Forward-Looking Airbnb Data
This feature provides analyzing Vrbo and Airbnb data by providing a forward-looking view of the exact dates over the next six months that are getting booked now. By doing so, one can adapt their strategy and gain a competitive advantage. This feature is also useful in understanding the difference between how the specific market is advertising the prices and the rate at which they are booked.
