
HOW ARE YOUR OTAS PERFORMING?
Where should you be putting your efforts into getting bookings for your vacation rental?
Wouldn’t it be nice to predict which online travel agencies (OTAs) are becoming more successful in your area, so you can concentrate on them? Is Airbnb growing faster than Booking.com, or vice versa? Or is Tripadvisor emerging a winner? Where should you be putting your efforts to help your vacation rental succeed?
It is really hard to get reliable data that tells you how the online travel agencies are performing locally for your customers. The current trend is also hard to understand.

It is true to a large degree that you can predict the future by looking in the rear view mirror. What has been the past trend? What will happen if it continues?
Fortunately Google gives you a way to get a good overall impression about the trend with OTAs in your country, to help you make better decisions for your vacation rental.
Google Trends reporting tool
Google Trends (trends.google.com) gives you a good report on what people are searching Google for over time, and how different searches compare with each other. You can see the results worldwide, by country and over time.
This article shows you what those trends are for the major OTAs. You can see what is happening globally, in the USA, Australia and the UK. You can also run your own report for any other country in a few seconds.
1 GLOBAL trends for the main OTAs
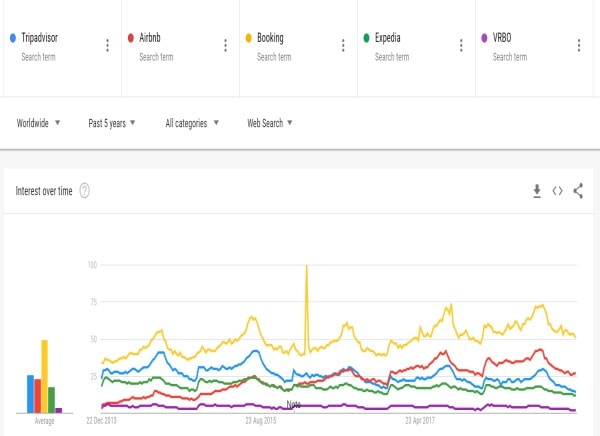
This graph below shows the relative volumes of searches worldwide, for Tripadvisor, Airbnb, Booking, Expedia and VRBO over the past 5 years.
It shows:
- Tripadvisor (blue) gradually declining
- Airbnb (red) rapidly growing from a small base to be a higher proportion than Tripadvisor or Expedia (green), and flattening off in the past year. The flattening off is consistent with observations reported by Skift
- Booking (yellow, proxy for Booking.com) dominating globally and steadily increasing
- Expedia is declining slightly over time, and VRBO (purple) is relatively small on the global stage.

[You can recreate the source report yourself by going to google trends, setting the time to a year and inserting the search terms to be the same as the diagram, ie Tripadvisor, Airbnb, Booking, Expedia, VRBO.]
Limitations: Searches will be for all kinds of accommodation, including hotels and vacation rentals, and in a few cases like Tripadvisor people will be searching for travel guidance and restaurants. It doesn’t include people searching for the OTA and location, eg ‘Airbnb Paris’, ‘Airbnb Sydney’, etc. It doesn’t include people who search from within apps.
The volume of searches may not correlate directly with bookings made, for many reasons. However, the power of the tool is that it is consistent over time, and it can pick up industry shifts. There have been quite a few, eg growth of Airbnb.
2 USA trends for the main OTAs
The graph shows:
- Rapid growth by Airbnb to dominate the USA, with some flattening off over the past year
- Expedia has dominated, but is in slow decline
- VRBO is a steady smaller player
- Booking.com is a small player in the USA, with slow but steady growth
- Tripadvisor is slowly declining

3 AUSTRALIA trends for the main OTAs
The graph shows:
- A rapid increase by Airbnb to dominate the market, but flattening off over the past year
- A steady increase in Booking.com, to the extent where it is matching Airbnb
- Slight decline in Expedia
- A rapid decline in Stayz, consistent with its transfer to parent Homeaway’s platform earlier this year. A separate graph (https://trends.google.com/trends/explore?date=2013-12-31%202018-12-31&geo=AU&q=Homeaway,Airbnb,Booking,Expedia,Stayz) shows almost no uptake of Homeaway as a search term, putting a cloud over the future of Stayz/ Homeaway.
- The same steady decrease in Tripadvisor as in other markets
As an aside, on the ground reports echo exactly these trends, but far more vivid when translated into the harsh world of real bookings.

4 UNITED KINGDOM trends for the main OTAs
The graph shows:
- Airbnb with a rapid increase in early years, but has flattened off in the last year
- A slow but steady increase in Booking.com to lead Airbnb
- A sizeable decline in Tripadvisor, but it is still ahead of Airbnb
- A slow decline in Expedia, and zero VRBO

What is the trend in YOUR area?
You can take the base graph here and change the locality from Worldwide to your country and in most cases, you can even specify a state within a country. That will give you a comparison of what your local customers are searching for.
You can also change the search term to include a local OTA that you know about to test how it is performing. In Australia, that would be Stayz, until recently the dominant local OTA for holiday rentals. You just add the OTA you want to check out.
Conclusions
Search trends are a good indicator of relative changes in traffic to the main OTAs.
The high level trend seems to be domination by Airbnb and Booking.com, with trends to lower performance by Tripadvisor and Expedia. These changes are clearer in specific places, for example in Australia.
Where there is an apparent trend to a shift in the market, property owners will do well to test actual booking outcomes with colleagues in their local market, and take advantage of the shift. For example, where there is an emerging dominant OTA, owners should put effort into making sure their listing is updated and attractive.
In cases of a badly performing OTA, it might be worth pausing the listing and concentrating on the dominant OTAs. Some smart owners are doing that right now.
How about you? Are you working on the best OTAs right now?
Updated 29Jan2019.
My name is Rex Brown. I live in Australia, on the Great Ocean Road in Victoria. I run two of my holiday rentals here on the coast, and another in inner Melbourne . They are all quite different, but they all run at high occupancy. They are the sandpit that I play in, running constant experiments about what works and what doesn’t.