As a short-term rental manager, how can you use demand and supply data to confirm what you see happening in your books or the streets around you? How can you also use data to make sense of what you hear from companies like Airbnb and Booking when they talk about their financial performance? To see how you use data to fact-check what you hear and what you see, let’s use the example of the European short-term rental market in July 2022. To do so, we’ll leverage AirDNA’s latest monthly report and see whether its data can explain:
- The feeling that European cities are once again filled with travelers from all over Europe and North America.
- Why Booking.com’s demand numbers only surpassed Q2 2019 numbers in Q2 2022, while Airbnb’s numbers have been above 2019 levels since 2021.
European city streets look and sound like the Tower of Babel again
Since June 2022, European city streets finally look and sound again like the Tower of Babel: If you take a stroll in the streets of Paris, Florence, or Lisbon, you can hear multiple languages being spoken. Car plates of various provenance adorn once again Europe’s roads and highways: Germans in The Netherlands, Dutch and Belgian in France, French in Italy and Spain, etc. The war in Ukraine has added Ukrainian car plates to the mix all over the continent. Finally, Americans are back in large numbers, aided by the weakening of the euro vs the dollar (-15% over the last 12 months).
Using AirDNA’s report on the state of European short-term rentals in July 2022, let’s see whether can back with data on some of these anecdotal facts. For instance:
- Does the data show that cross-border and international travel is back to 2019 levels?
- Can we see in data that big urban markets such as Paris and Lisbon have rebounded?
International travel is back in Europe with a vengeance, after two years of coming-and-going travel restrictions
For instance, this is what AirDNA has to say about the growth in international bookings on Airbnb in Q2 2022 (April, May, and June 2022) vs Q2 2021 (April, May, and June 2021) :
In Q2 2022, Hungary, Greece, and Croatia respectively saw 342.1%, 116.5%, and 80.4% more Airbnb reservations made by international travelers year over year, while reservations made by domestic travelers in the same comparison period had declined in each of these countries.
Lockdowns may have blurred in our memory, yet you may remember that some countries were actually adding new restrictions in Spring 2021. For instance, France imposed a complete lockdown from 3 April 2021 to 29 April 2021, during which people could travel more than 10 km away from their homes. Curfews in France completely ended on 30 June 2021. So, with just this one example of a major travel destination, you can guess that Q2 2021 was not the best quarter ever for travel professionals in Europe.
The graph below also looks at the difference in Airbnb reservations in Q2 2022 vs Q2 2021. For a select group of cities such as Dublin, Florence, and Rome, it shows that the number of reservations by international guests has increased by between 150% and 800% compared with 2021 (in green in the graph). It also shows that, for these cities, the absolute number of reservations made by domestic travelers (e.g. by the Irish in Dublin or the Italians in Florence and Rome) actually decreased.
Armed with these data, you can find some reasons to back up the feeling that Italian cities went from monolingual in 2020 and 2021 to multilingual in 2022, with international arrivals booming by more than 500% in Florence, 400% in Rome, and 300% in Venice, for instance.
Demand and supply are coming back to Europe city markets, yet still under 2019 levels in some places
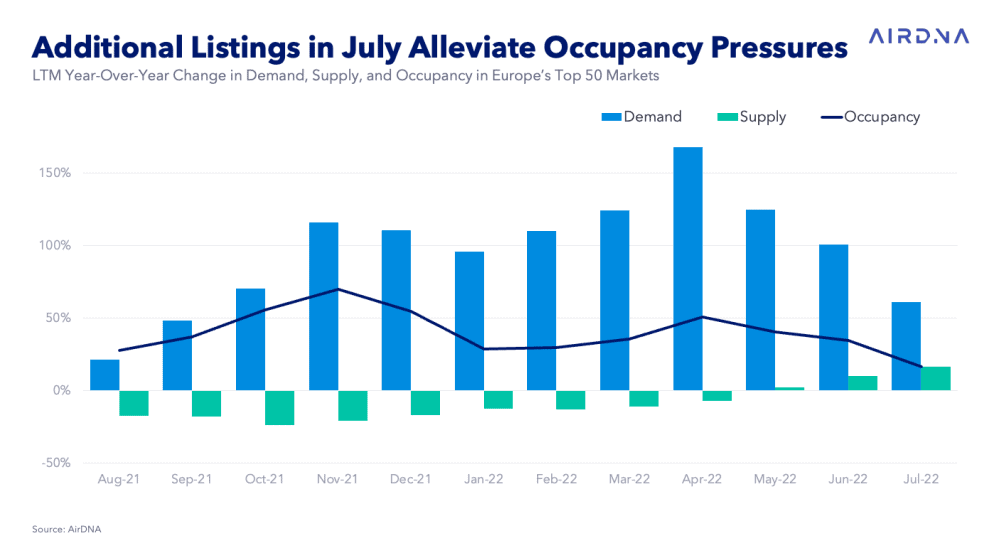
In the graph below, AirDNA show has compiled data from the top 50 largest European markets. A lot of them correspond to big cities. So, we’ll use it as a proxy to understand what’s happening in urban markets.
When it comes to demand, you can see that it has grown by more than 100% compared with 2021 in February, March, April, May, and June. July demand “only” increased by more than 50%. Granted, these numbers started from really low, given the devastating data in 2020 and 2021 for urban travel in Europe. For instance, in July 2022, total demand in Dublin still remained 62.7% below 2019. So, demand is rising above 2021 numbers, but we are still not on 2019 levels in many big cities.
The same thing will supply: it remained 29.5% below 2019 in July in these top 50 markets (a proxy for large cities). Note that supply is “only” -4% from 2019 for the overall European market, according to AirDNA data. It means that the number of listings available has rebounded faster in non-urban markets. Supply in the top 50 markets only started growing again in May 2022, but the pace is accelerating.
European travel company Booking.com rebounds much later than the American Airbnb
When looking at Booking.com and Airbnb’s financial results, it is striking to see that Booking’s demand numbers only started surpassing 2019 levels in Q2 2022. So, it took the company 2 years to go back to the same number of booked nights as in 2019. Meanwhile, Airbnb’s demand numbers surpassed 2019 in 2021. They did not have to wait for 2022. Can AirDNA’s data help us again here?
It is not secret that Booking.com’s supply and demand are very skewed towards Europe. Even more so for its short-term rental supply. On the consumer side, Booking.com is not a household name in the US, despite spending money on a Superbowl commercial a few months ago. It has also struggled to attract American hosts, as its product lacked key features such as liability insurance until recently.
Meanwhile, before the pandemic, Airbnb had managed almost to balance its US and European businesses: In 2019, North America represented 41% of Airbnb’s revenues, while Europe, Africa, and the Middle East (EMEA) represented 40% (see Airbnb IPO prospectus).
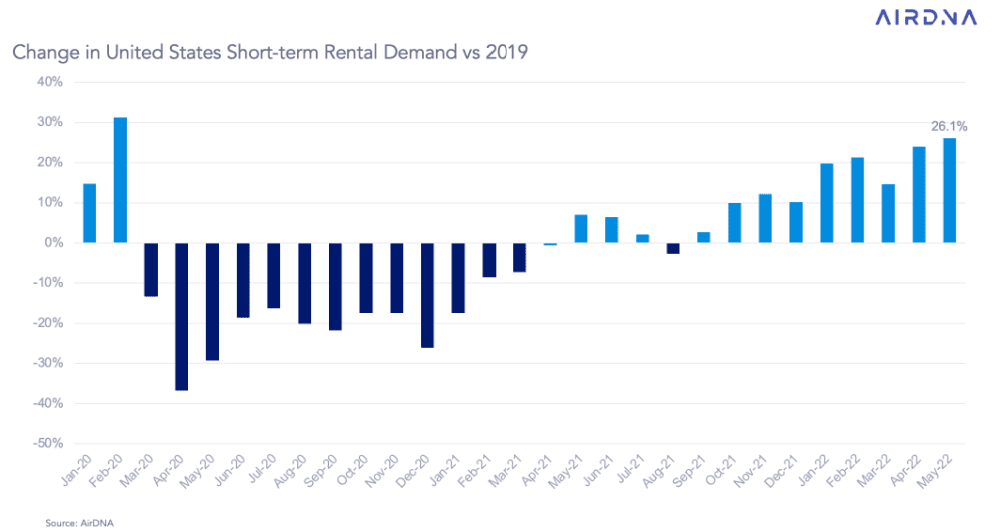
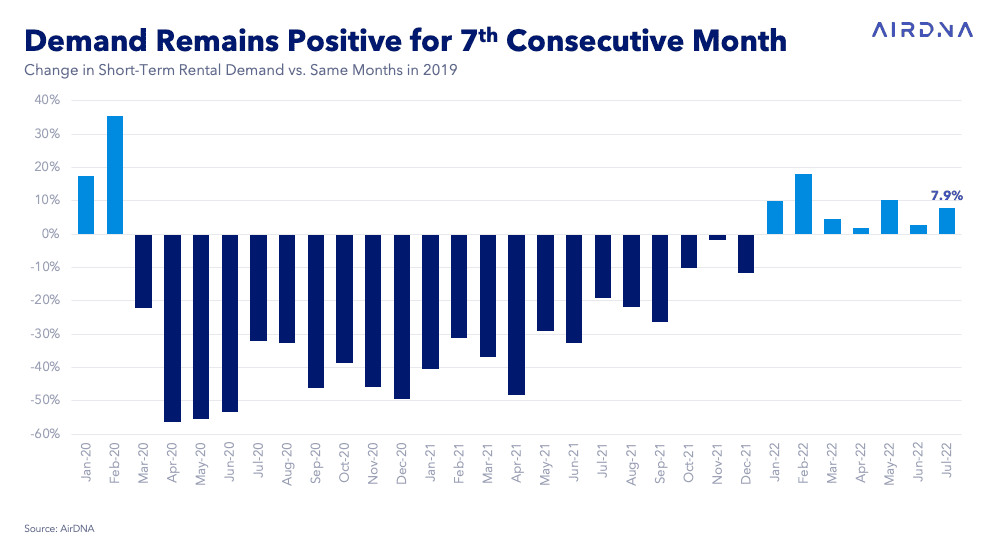
So, whatever happens in Europe influences Booking.com even more than Airbnb. For instance, demand for short-term rentals has returned in the US faster than in Europe. We can see it by comparing these two AirDNA graphs about demand in the US and then in Europe. As you can see below, demand started surpassing 2019 levels as soon as April 2021 in the US. Meanwhile, in Europe, demand only reached 2019 levels in January 2022, i.e. 9 months later.
US demand for short-term rentals starts surpassing 2019 levels in April 2021
European demand for short-term rentals starts surpassing 2019 levels in January 2022
This graph helps explain why Airbnb, which is stronger in the US than Booking.com, saw an earlier and higher increase in reservations in 2021.
On the supply, as we noted above, the number of listings has been increasing again, albeit only since May 2022. The pace is accelerating, with a 19.2% supply increase in July 2022 vs July 2021. This may explain why Booking.com says that it has noted record jumps in listing additions. Booking.com saw, in Q2 2022, “the largest sequential net increase in alternative accommodation properties since 2019”. The company now boasts 6.6 million alternative accommodation listings, about ⅔ of which are short-term rentals.


![Trump-Era Policies Fuel Travel Uncertainty: Fewer Canadians, Europeans to U.S.—Fewer Americans to Europe [Early Data] 7 Trump-Era Policies Fuel Travel Uncertainty: Fewer Canadians, Europeans to U.S.—Fewer Americans to Europe [Early Data]](https://www.rentalscaleup.com/wp-content/uploads/2025/04/Trump-Era-Policies-Fuel-Travel-Uncertainty-Fewer-Canadians-Europeans-to-U.S.—Fewer-Americans-to-Europe-Early-Data-150x150.jpg)


