2021 was a record year for US Vacation rentals: Overall, demand was 10% higher than pre-pandemic levels (2019), the industry generated 40% more revenues thanks to record-breaking ADR (average daily rate) levels, all with 10% fewer listings available. What will 2022 US vacation rental trends be like? Let’s look at AirDNA’s data to anticipate key changes. In the first year of the pandemic, travelers have learned to anticipate trends such as high demand for large properties in the summer, look for properties that allow remote working, and enjoy the Indian Summer months. Yet, the return of travel to cities, the coming and going of COVID variants, and the increase in house prices should impact demand and supply in contradictory ways. For instance, more demand for urban stays will drive ADR down (city rates are cheaper on average), while the supply in traditional vacation rentals markets will not grow to its potential with home prices skyrocketing.
In 2022, the growth of available listing should jump up, while the growth in demand will be lower than in 2021. Still, occupancy should remain high in the US, except in large urban areas. AirDNA does not demand and supply coming back to pre-pandemic in cities like New York and San Francisco before 2023 or even 2024.
2022 vacation rental trends: The metrics to look at
We’ll look at key metrics and data, as predicted by vacation rental data company AirDNA, to look into 2022 US vacation rental trends.
it is important for owners and managers of vacation rentals to be knowledgeable about key terms used in the industry. Here are some definitions:
- Demand: The number of people interested in booking a vacation rental unit in a given market.
- Supply: The number of vacation rental units or listings available in a given market.
- ADR: Average Daily Rate – the average rate charged for a rental unit, room, or bed per night.
- Occupancy: The percentage of a property’s available units that are occupied at a given time.
- Revenues: Total income generated by a property, typically over a given time period. Revenue is a factor of occupancy and ADR: The more people stay, the higher the revenues. The higher the rates (ADR), the higher the revenues as well.
- RevPAR: In hotel reporting, RevPAR is Revenue Per Available Room and is calculated by multiplying the Average Daily Rate (ADR) by the occupancy rate. Here, RevPAR is the Revenue Per Available Rental and is calculated by dividing the total revenue earned by the number of available listings.
2022 vs 2021 DEMAND trends:
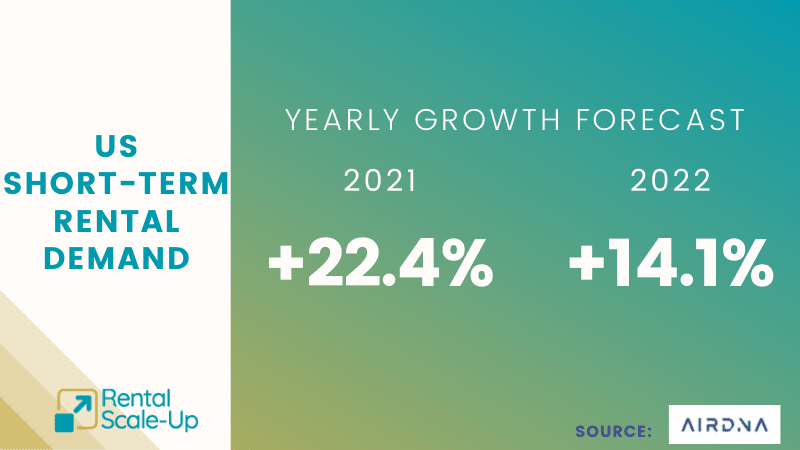
According to AirDNA, demand should still grow in 2022, but at a slower pace than in 2021. In 2021, demand grew by +22.4% compared with 2020. Demand is expected to grow another 14.1% in 2022 over 2021 levels.
Urban markets
In 2021, urban areas recorded 38% fewer nights stayed in 2021 than in 2019. In 2022, however, AirDNA expects that demand in urban markets will grow by 33%, ending the year 17% below 2019. In 2022, demand growth will be highest in large cities as their recovery catches up to other areas.
It will probably be 2023 before urban areas fully recover demand, with some cities—like New York, Boston, and San Francisco—taking even longer.
Coastal markets
The remote work trend has been a major factor in spreading peak demand across more months and helped make the economy stronger.
Coastal and mountain/lake destinations are likely to see the biggest negative impact from changing travel patterns, but that impact isn’t expected to start showing up until the back half of 2022. Overall demand for properties in coastal destinations is expected to grow by just 3% in 2022.
Booking patterns
With travelers learning from this year, we expect that guests will plan even further in advance for 2022 to secure top properties in the most desirable location
As of Q4 2021, lead times are now exceeding those of 2019, with guests booking 60 days in advance on average.
2022 vs 2021 SUPPLY trends
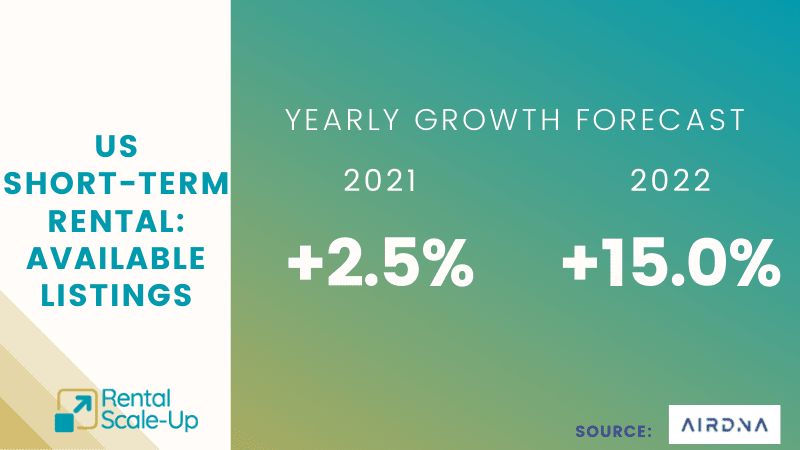
Overall listing numbers have seen little growth in 2021. AirDNA thinks that available listings grew by 2.6% in 2021. Weak demand in large urban areas has not tempted some supply to go back to the short-term rental market yet. In vacation rental markets, high property values are making it harder for people to purchase a second home and make it available to guests.
The return of demand to small cities and destination/resort markets throughout the U.S. has led to significant gains in new supply in these areas
With the number of available listings still 9% below 2019 levels and existing properties essentially full during peak travel periods, demand growth will hinge on more supply coming online to accommodate more travelers or higher occupancy of existing listings.
Overall, AirDNA expects a 15% increase in U.S. listings in 2022 over 2021, with gains spread across large cities and destination/resort markets
Here are a few factors which negatively impacted supply growth in 2021:
- Owners using of second homes to work remotely.
- Stronger demand for long-term housing.
- Home price appreciation reducing investment.
What is the most attractive type of supply?
Large properties got booked in 2021, while the supply of unique properties have grown. Tiny houses were the fastest-growing short-term rental property type, growing 27% percent to 8,402 listings. These were followed by nature lodges, buses, and huts.
Not surprisingly, all 10 of the fastest-growing property types provide unique experiences. Meanwhile, the largest categories of properties—homes, and apartments—both saw a decline of more than 5% in listings over the past year.
2022 vs 2021 OCCUPANCY trends
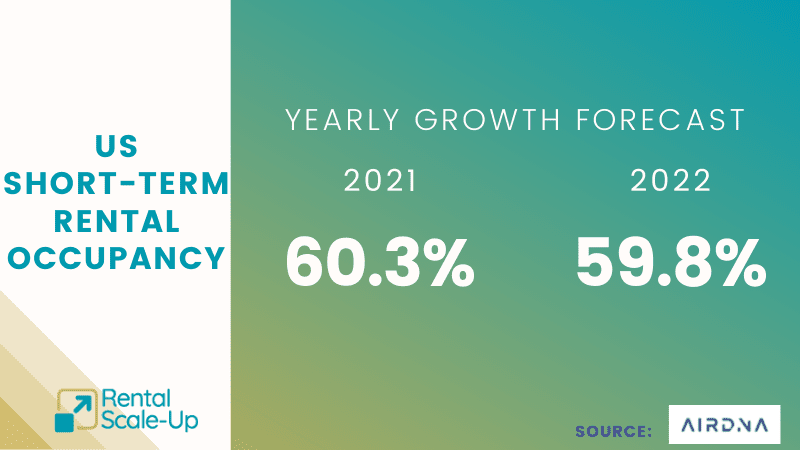
In 2021, low supply growth, combined with a boom in demand (outside of large cities) allowed for higher average occupancy levels for short-term rental operators. AirDNA estimates that 2021 occupancy was around 60.3%.
Occupancy is set to continue its strong trend in 2021 with an average rate of 59.8% in 2022.
2022 vs 2021 ADR trends
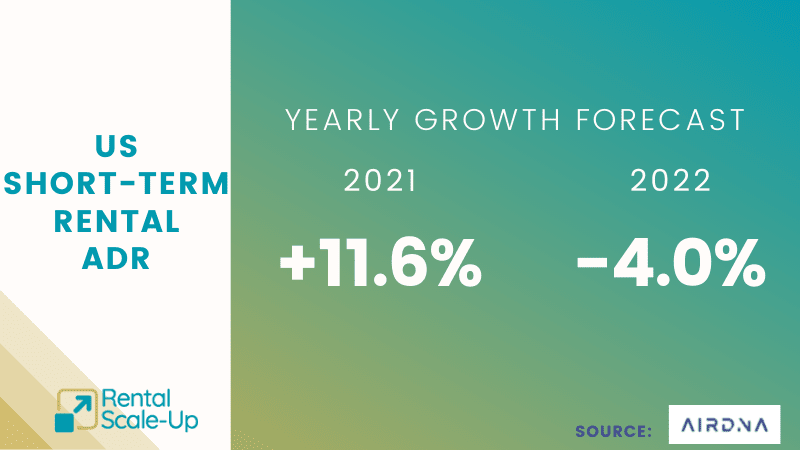
Higher occupancy and rising price inflation throughout the economy allowed hosts to raise average daily rates (ADRs) even further throughout the last half of 2021. ADRs should end the year up 11.6%.
However, in 202, ADR will decrease by 4%, with most of the drop caused by:
- a changing mix of properties being rented in 2022 compared with 2021. For example, demand growth will be strongest in urban markets, where ADRs are lower—$185 ADR in 2021 compared with the U.S average of $260.
- changing seasonal patterns – Properties where peak season extended into the shoulder season may have to reduce pricing as seasonality adjusts to future demand trends.
- New supply – Increased revenue potential should bring new entrants into the market. This additional supply could reduce pricing power, especially during peak periods.
2022 vs 2021 REVENUE (RevPAR) trends
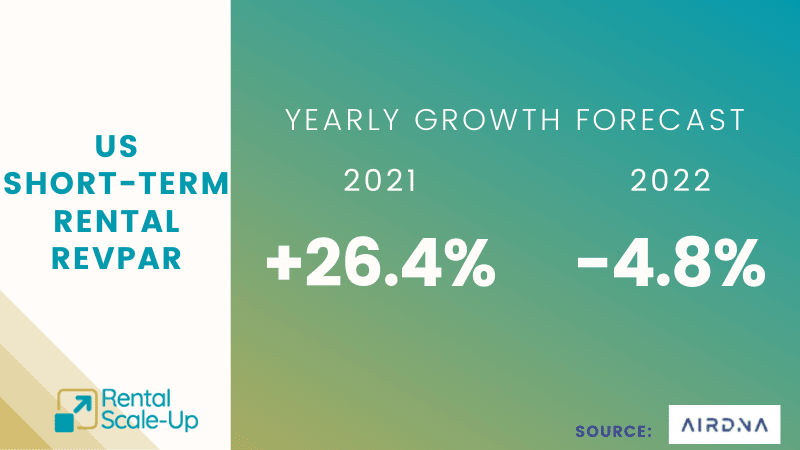
The average annual revenue earned by short-term rentals listed full-time grew to $56,000—its highest level ever—at the end of 2021 The combination of higher occupancy and ADR growth has resulted in stronger revenues per listing (RevPAR). On average, listings are expected to earn 26.4% more revenue in 2021 compared with 2020
Revenue per available listing will settle down due to the influx of new operators and decreased nightly rates. The combination of increased supply and weakening ADR growth will lower the overall revenue potential for the U.S. in 2022, with an expected decline of 4.8%. It is expected to stabilize and increase again starting in 2023.

