Here are our favorite data and quotes from Airbnb’s Q4 2021 financial results released this week. You can also check our related post on Airbnb’s 2022 strategy.
First, let’s get the picture: Airbnb’s Q4 2021 and overall 2021 financial data
What Brian Chesky, Airbnb’s CEO, had to say about the Q4 2021 results
“The fourth quarter was another record quarter and 2021 was the best year in Airbnb’s history – despite the global pandemic. We are amidst the biggest change to travel since the advent of commercial flying. Airbnb’s adaptable model and relentless innovation are making it possible for us to grow this new category of travel we created.”
Through the adaptability of our model and continued innovation, we were able to close out 2021 with our strongest Q4 ever. Despite the headwinds from Omicron, GBV was $11.3 billion in Q4, representing 32% growth compared to Q4 2019 attributable to nights booked recovering and strength in ADR. Guests are returning to cities and planning more travel despite variants and surges. Our Host community continues to thrive and is larger than ever, with 6 million active listings at the end of 2021.
Q4 revenue of $1.5 billion was 38% higher than Q4 2019. It also exceeded Q4 2020 revenue by nearly 80%. Both year-over-two-year and year-over-year revenue growth rates were further improvements from those achieved in Q3 2021 of 36% and 67%, respectively, despite the impact of Omicron in December 2021. Overall, 2021 has proven to be an incredible year demonstrating the resiliency of the business, with 25% year-over-two-year revenue growth.
Key figures we noticed and our take on them
Airbnb says: Domestic and non-urban travel have grown throughout the pandemic, with non-urban gross nights booked up nearly 45% compared to Q4 2019.
Our take: Before the pandemic, the main use case for booking in Airbnb was for a couple to find a place for a weekend in a big city. Emphasizing the growth of stays booked in non-urban markets is important to show that Airbnb has managed to develop this part of the market.
Airbnb says: In the U.S., gross nights booked for urban travel were up compared to Q4 2019.
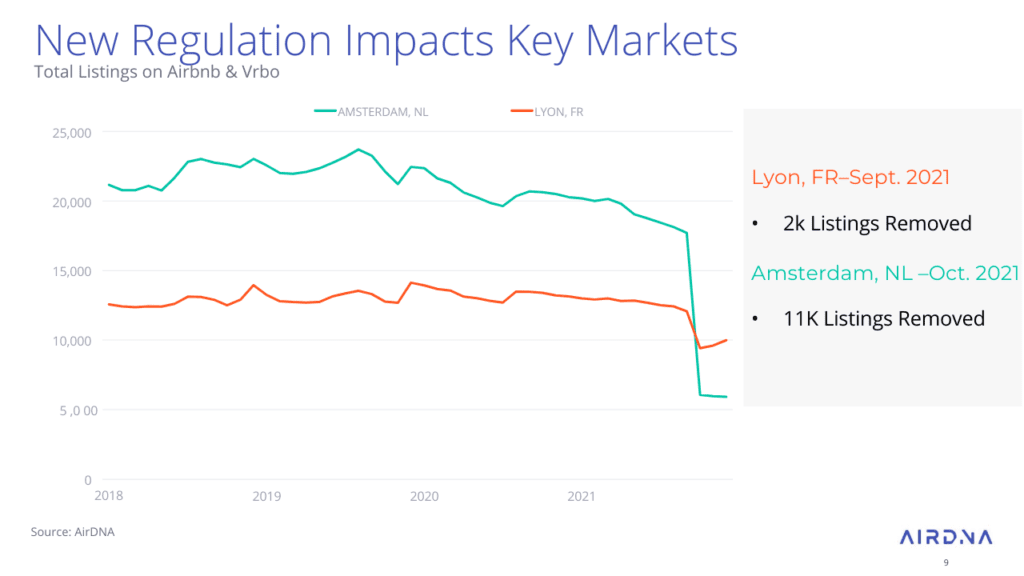
Our take: For the last two years, Airbnb has downplayed its traditional strength in urban markets. Now that travelers are booking in big cities again, the company wants to show that it is ready to catch the demand. Note that Airbnb mentions here the US market, as the picture is probably quite different in Europe for two reasons: In Q4 2021, more travel restrictions applied to European cities than in the US (e.g. Vienna, the capital city of Austria) went into lockdown for several weeks. Second, Airbnb’s urban listings have started bouncing back in the US, back cities like Prague, Lyon, and Amsterdam still had 70% fewer listings in late 2021 than in early 2019 (short-term rental bans and regulations have kicked in there).

Airbnb says: As of the end of January 2022, we had over 25% more nights booked for the summer travel season than at this time in 2019.
Our take: This is also an interesting figure. It can mean that demand is stronger overall or that people are just booking earlier than in 2019 for fear of not finding anything available by Q2 or Q3.
When we covered 2022 vacation rental trends with AirDNA, we noticed that, in the US, bookings for Q3 (summer) were very strong. One of the reasons could be that travelers learned from 2021 when short-term rental supply was short in some regions and started booking early. AirDNA showed us that it is true in the US, but a bit less so in Europe where travelers have been waiting for the Omicron-related restrictions to clear up before booking in drove.
Airbnb says: Average trip length increased by approximately 15%, with stays of more than 7 days now representing nearly half of all gross nights booked.
Our take: This trend is very important for Airbnb, as it validates its “Live Anywhere on Airbnb” 2022 focus, part of its 2022 strategic plan. While Airbnb talked up stays over 28 days during the pandemic, the company seems to show that it is a place for extended stays, from long weekends to monthly stays.
Note that this is an average figure: Once short trips to cities for 1 night or 2 become commonplace again, the average can go downwards.
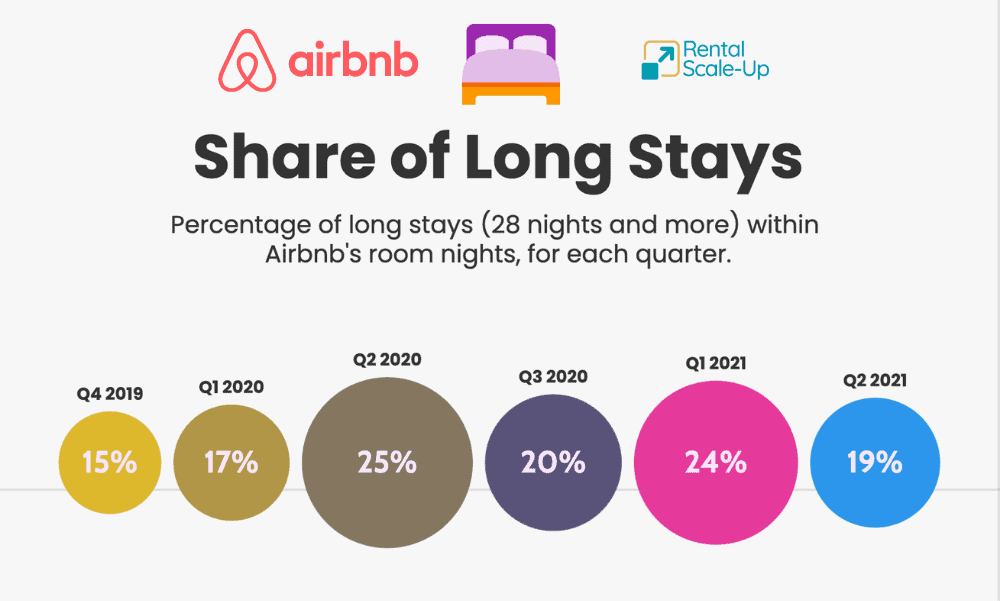
Airbnb says: Long-term stays of 28 nights or more remained our fastest-growing category by trip length and accounted for 22% of gross nights booked in Q4, up 16% from Q4 2019.
Our take: In 2021, we compiled data about long stays on Airbnb. Airbnb says that the share of long stays was 16% in Q4 2019 and we estimated them at 15%, so not too far off. Missing from the chart below is Q3 2021, with 20% of gross nights booked recorded as long stays. At 22% in Q4 2021, the long-stay figure is respectable, but lower, than Q1 2021, for instance. As shorter trips can come back, the share of long stays gets mechanically limited in growth.

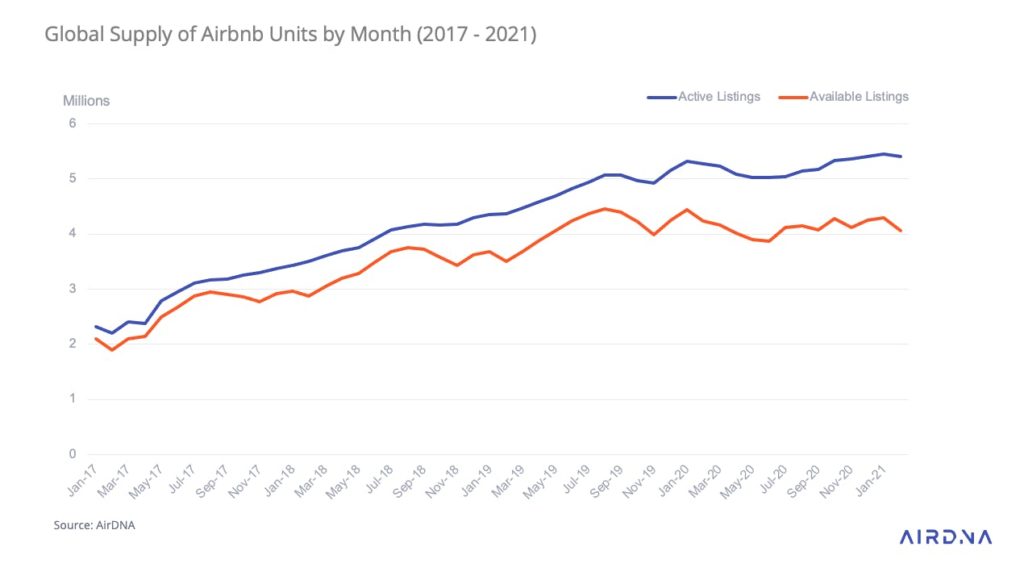
Airbnb says: Host community is larger than ever, with 6 million active listings at the end of 2021.
Our take: Getting more supply is key for Airbnb. In some cities, lack of demand and short-term rental bans have dented Airbnb listing numbers. Some listings have left the platform entirely, while some are still in the system (“active”) but are not bookable (“not available”).
As per Airbnb’s own definition:
What is an “active listing” on Airbnb: “We consider a listing of a home or an Experience to be an active listing if it is viewable on Airbnb and has been previously booked at least once on Airbnb.”
Here’s how AirDNA distinguished between Active and Available listings:
Active Listings: Number of listings viewable on Airbnb with at least one prior booked night.
Available Listings: Number of active listings that have calendar availability or at least one booked day in the month.
Airbnb shared that, in non-urban markets in North America, it had managed to increase its listings by 20%. Yet, it needs to find more supply. This is why “unlocking the next generation of hosts” is part of Airbnb’s 2022 strategy, just as “Recruiting more Hosts and setting them up for success” for part of its 2021 strategy.
The whole industry is busy running aggressive vacation rental homeowner acquisition campaigns, from small vacation rental managers to giant OTAs like Airbnb and Vrbo.
Airbnb financial data at a glance, as taken from its Q4 reports and earnings call
- Demand
- Airbnb saw continued strength in Nights and Experiences Booked in North America, EMEA and Latin America, all of which have driven significant year-over-year growth.
- In Q4 2021, Nights and Experiences Booked of 73.4 million represented a significant increase from a year ago (+59% Y/Y) and slight decrease compared to Q4 2019 levels (-3% Y/2Y).
- Per regin
- North America remained strong, with Nights and Experiences Booked increasing 20% above the level achieved in the same quarter of 2019, primarily driven by the U.S. • In EMEA, Nights and Experiences Booked were slightly below 2019 levels due primarily to the emergence and uncertainty around Omicron. 12 • In Latin America, Nights and Experiences Booked were 22% higher than Q4 2019 with continued resilience in certain countries, such as Brazil and Mexico, where both domestic and inbound cross-border travel continued to strengthen. • In Asia Pacific, Nights and Experiences Booked remained depressed compared to Q4 2019 as many countries in the region that have historically been more reliant on cross-border travel remained closed. However, Nights and Experiences Booked increased 22% compared to Q3 2021 primarily due to the lifting of certain travel restrictions in countries such as Australia
- Urban vs Non-urban
- While travel to top cities has not yet entirely recovered to 2019 levels, we are seeing signs of travelers returning to cities (historically one of the strongest areas of our business). Share of travel to high-density urban areas increased in Q4 2021 from the prior quarter, representing 49% of our gross nights booked in Q4 2021 compared to 46% in Q3 2021. Similar to crossborder travel, gross nights boo
- First, guests are staying in thousands of small towns and rural communities on Airbnb. Throughout the pandemic, we’ve seen growing demand for domestic and nonurban travels. In Q4, gross nights booked in nonurban markets was up nearly 45% from Q4 2019. And in the past year alone, Airbnb guests stayed in nearly 100,000 towns and cities all around the world.
- Second, guests are also returning to cities. Q4 nights booked at urban destinations have recovered to — nearly recovered to Q4 2019 levels. And cross border travel also continues to recover and improved each quarter in 2021. Guests are planning to travel despite variants and surges.
- Long stays
- In Q4 2021, long-term stays of 28 days or more remained our fastest-growing category by trip length compared to 2019 as the way people travel and live continues to change. Long-term stays accounted for 22% of gross nights booked in Q4 2021, up from 16% in Q4 2019. Overall, 47% of gross nights booked were from stays of at least seven nights in Q4 2021.
- Nearly two years into the pandemic, it’s clear that we are undergoing the biggest change to travel since the advent of commercial flying. Remote work has untethered many people from the need to be in an office. And as a result, people are spreading out to thousands of towns and cities, staying for weeks, months, or even entire seasons at a time.
- For the first time ever, millions of people can now live anywhere. And we’ve been able to respond to these changes because our model is inherently adaptable
- ADR
- ADR averaged $154 in Q4 2021, representing a 20% increase compared to the same prior year period, and a 36% increase compared to the same period in 2019. Q4 ADR remained elevated and outperformed our expectations that it would be stable relative to Q3. The sequential increase in ADR from the prior quarter of $149 was primarily driven by continued strength in North America. Consistent with Q3, we saw an almost equal impact from mix shift and price appreciation on ADR. We continued to see significant mix shift towards bookings in North America, entire homes, and non-urban destinations, all of which
- Supply
- We ended Q4 with our highest number of active listings yet. Growth was again strongest in non-urban areas, where guest demand was highest. Consistent with where we’ve generally seen bookings recover, we’ve seen the most active listings growth in Q4 2021 compared to Q4 2019 in Latin America, followed by North America and EMEA.
- Gross Booking Value (GBV
- Strong recovery in Nights and Experiences Booked combined with higher Average Daily Rates (“ADR”) drove over $11 billion of GBV in Q4 2021. Both Q4 and FY 2021 saw significant increases in GBV from a year ago as well as from pre-COVID periods in 2019.
- Revenue
- Revenue for both Q4 and FY 2021 were up nearly 80% year-over-year and exceeded 2019 levels— demonstrating the strength of Airbnb’s recovery.
- The increase in revenue was driven by the recovery in Nights and Experiences Booked, combined with a higher ADR. Compared to Q4 2019, revenue in Q4 2021 increased 38%, driven by higher ADR offsetting slightly fewer nights stayed.
- Net Income (Loss)
- Net income was positive in Q4 2021 (and a record for the fourth quarter), driven by our top-line recovery and continued expense discipline.
- Net income in Q4 2021 was $55 million, our strongest fourth quarter ever, compared with net loss of $3.9 billion in Q4 2020. This positive change was driven by several factors. First, we had substantially higher revenue in Q4 2021. Second, our net loss in Q4 2020 included certain one-time IPO-related costs, including $2.8 billion of stock-based compensation expense and $103 million of associated taxes. It also included adjustments to the carrying value of certain warrants totaling $827 million. The improvement in net income compared to 2019 was primarily due to higher revenue and our significantly better cost structure as discussed further below.

- Adjusted EBITDA*
- Adjusted EBITDA was positive and our highest ever for both Q4 and FY 2021 due to our revenue growth combined with continued expense discipline.
- sales and marketing expense for Q4 2021 decreased by 25% compared to the same period in 2019, primarily due to a reduction in performance marketing expenses


