This month we at Hostaway had a webinar with our partner PriceLabs regarding 10 ways to adjust your prices in 2021. During the Q&A, it occurred to us that a lot of property managers are looking at their own calendars and pricing or generic news outlets without actually tracking changes in travel behavior. As we move forward into 2021, the changes we’ve seen since the pandemic started in March 2020 will continue to intensify.
More importantly, each property manager will be affected differently depending on their location, target audience, and property type. However, these changes do not exist in a vacuum. In 2021, many restrictions will be lifted, but travel demand will respond very differently depending on the region.
How can a property manager keep track of industry trends? The best resources are the dashboards of vacation rental revenue management systems. These tools allow you to narrow down to individual markets, analyze trends, and make actionable decisions.
To evaluate the travel industry’s recovery, property managers must monitor large data sets rather than just their own sales. Revenue Management Systems benefit from aggregating data from across the industry, providing a complete picture of the situation.
The most important vacation rental industry metrics are:
- Occupancy – The total number of dates booked in a given month
- Average Daily Rate (ADR) – The average nightly rate your property has been booked at.
- Revenue Per Available Listing (RevPar) – Your Occupancy multiplied by your ADR.
Monitor these metrics within the dashboards, keep a close eye on the trends, and correlate with pre-Covid levels. Is occupancy in your market returning to pre-pandemic normals? If so, check what the average daily rates are. Are they lower than the 2019 average? This may mean that guests are traveling again but still benefiting from low nightly rates. Which might suggest it is time to increase your daily rates. RevPar is the most complete metric to monitor because it combines both occupancy and ADR.
RevPar = Occupancy x ADR
Which companies offer the best analytics for tracking industry trends?
Many companies offer dashboard-level analytics, but very few actually provide the insights needed to understand industry trends. In the world of analytics, data is in huge supply, but real-insight is the hard-to-come-by commodity we’re all chasing.
PriceLabs – Market Dashboard
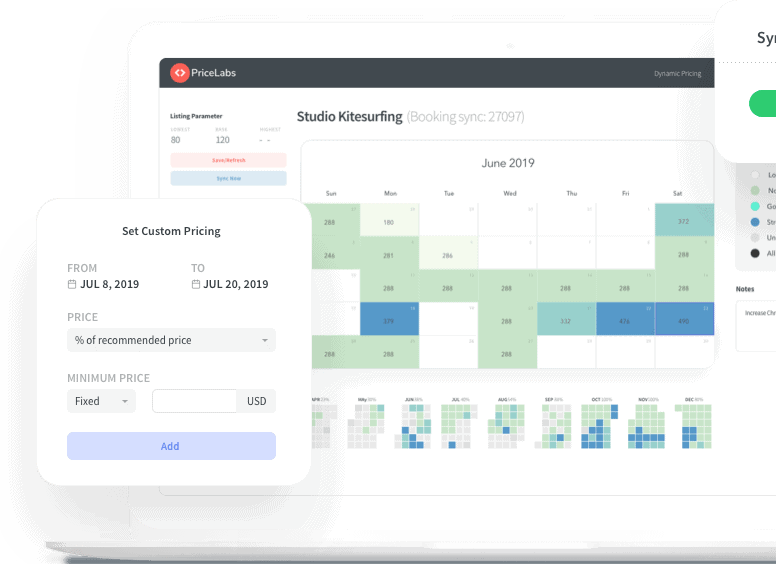
If you dive into the PriceLabs dashboard, you will be able to see a broad range of insights, from market summaries, the number of listings, overall booking trends, and filter by number of bedrooms.
PriceLabs has a very powerful “Amenities” filter, which allows you to slice your data and see which amenities are causing the most bookings. In many ways, the needs of guests have changed dramatically since the start of the pandemic, and it might be time to ensure that your properties have all of the most sought-after amenities.
Wheelhouse – Market Dashboard
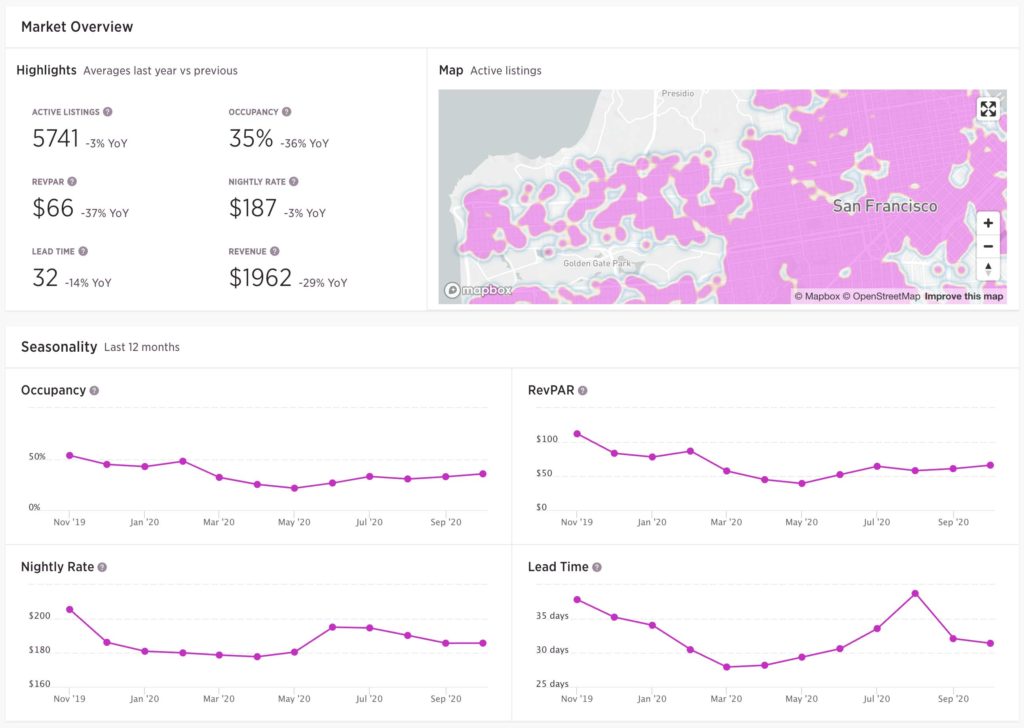
To get started with Wheelhouse, you’ll want to find your market, sign-up for a free or paid account, and analyze the available data. The dashboard will provide you with a Market Overview with the number of active listings, occupancy, RevPAR, and lead time. Comparing this data with your properties will help give you a benchmark understanding of how you’re performing compared to similar properties in your region.
Beyond Pricing – Property Manager Dashboard
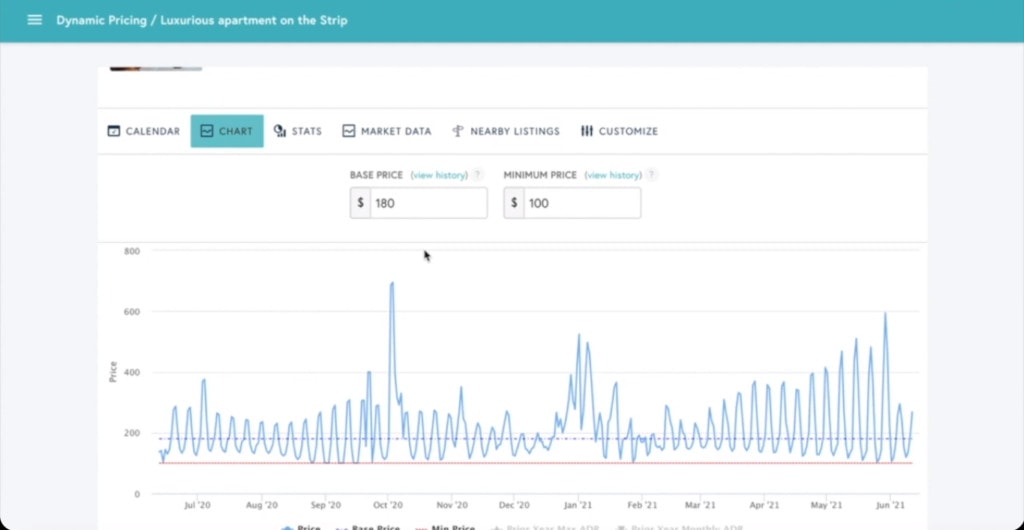
This dashboard has a very intuitive design that allows you to view free performance metrics for all of the properties in your portfolio. The platform will showcase up to four years worth of previous data so you can easily identify trends within your own portfolio.
Transparent – Property Manager Dashboard
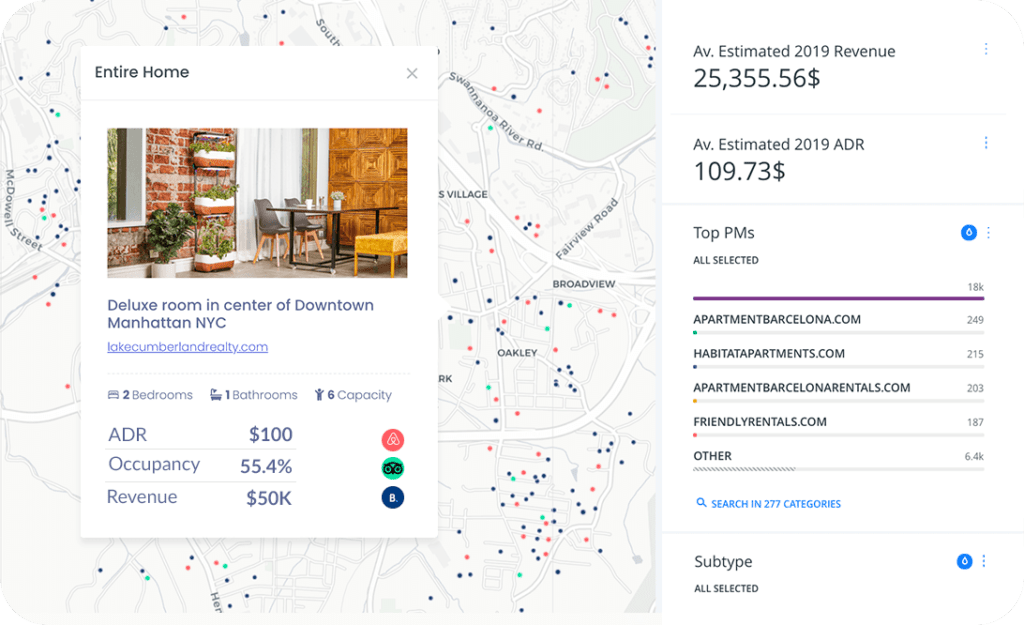
With the Smart Rental PRO dashboard, you can visualize actionable insights that will help you maximize your RevPar, enhance your OTA distribution, and identify supply trends to keep ahead of your competition.
How To Use Government Data To Monitor Tourism Performance
Government data is also valuable to monitor in conjunction with vacation rental market data. Combining the two sets of data will provide more depth and context to the data that you’re consuming.
Municipalities / Counties – Most local governments will monitor local tourism trends and publish the data for you as a business owner to stay up-to-date. Look out for findings that help answer questions such as:
- How has covid-19 impacted visitation numbers in your town?
- Are visitors spending more, or less, per visit?
- What are historical hotel occupancy rates, and how do they compare to now?
By understanding your local market, you will be able to identify opportunities that others may have overlooked. As an example, let’s say in your town occupancy rates are down, but visitation numbers are way up. This would suggest that visitors are not staying overnight at hotel-style accommodations. It could also be that those visiting are booking hotels for shorter stays, thus causing lower occupancy rates.
Provincial / State Tourism Associations – Almost every state/province has a tourism association responsible for tracking and reporting on tourism activity. This information can be handy for property managers making decisions that span across multiple cities or regions.
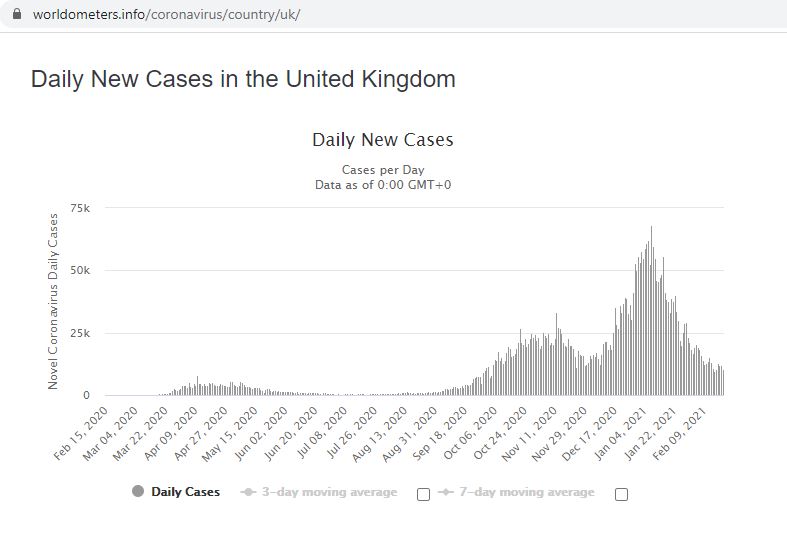
Worldometer – By tracking COVID-19 infection rates, you will be able to identify the growing trends across countries, states, and cities. Cities with lower than average rates of infection may experience higher tourism once travel-restrictions are lifted.
Our World Data – Our World Data is a great resource for tracking covid-19 vaccination rates. Regions with a higher vaccination rate may experience a surge in tourism once travel restrictions are lifted since travelers may feel safe knowing the community has a strong herd immunity.
