For vacation rentals in the US, on average, February was exceptionally bad in terms of the number of nights stayed, while it was just as exceptionally great in terms of new bookings recorded for the upcoming spring and summer months. Meanwhile, European numbers are languishing, with the gap with US vacation rental performance getting wider. How large is this gap? What is the impact on room nights and expected booking revenues? Let’s look at some answers through graphs, thanks to exclusive data shared by AirDNA, a leading provider of short-term vacation rental data and analytics.
Since the start of the COVID-19 crisis, we have noticed that overall vacation rental performance data remained better in the US than in Europe. Comparing continents can look too broad to be meaningful: Florida vacation rentals’ performance in 2020 and early 2021 is stellar compared with that of New York City apartments, for instance.
Demand (i.e. room nights sold) hit the bottom in the US, but Europe managed to dig deeper
AirDNA has plotted for us the evolution of demand since January 2020, in the US and Europe. We are looking here at the number of room nights sold (booked and earned) for a specific month. These are the nights which got “stayed” during a month. The graphs compare the evolution of numbers with the same month the year before.
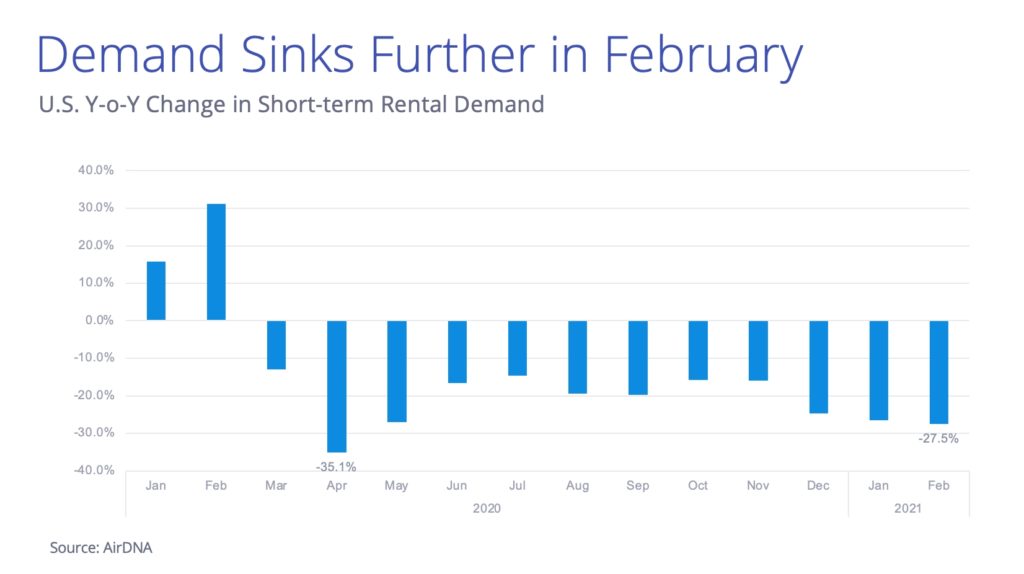
US demand data (room nights or unit sold, monthly, from January 2020 to February 2021)

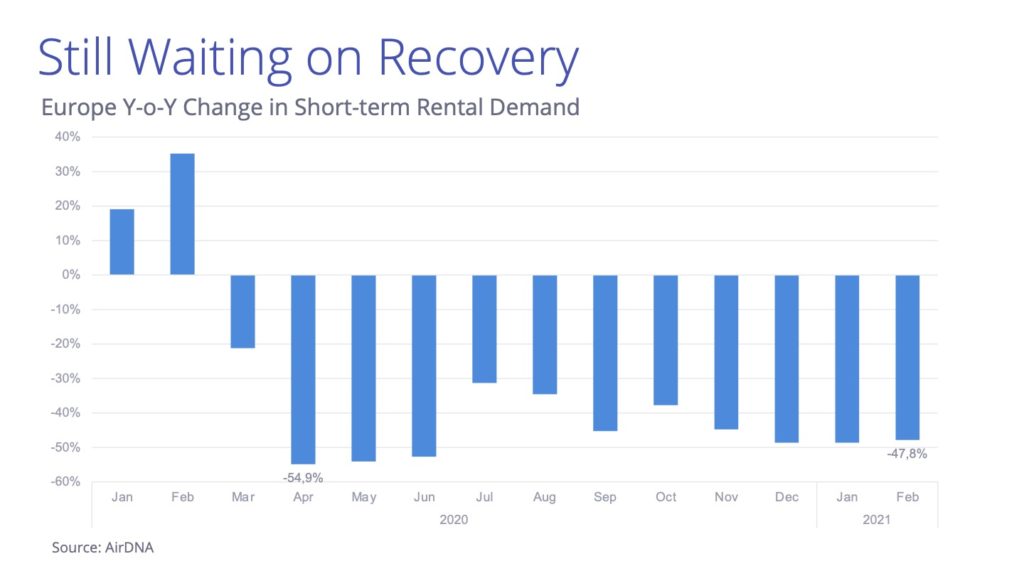
European demand data (room nights or unit sold, monthly, from January 2020 to February 2021)

In the US, demand for short-term rentals fell by 27.5%, compared with the same time in 2020, marking the worst month’s performance since the start of the pandemic.
European data has been in the negative too, but much deeper than in the US, for every month since March 2020.
For instance:
- April 2020 demand (room nights sold)
- US: -35,1%
- Europe: -54,9%
- February 2021 demand (room nights sold)
- US: -27,5%
- Europe: -47.8%
New Bookings are rebounding
The charts below illustrate the differences between:
- the actual stay revenues in one month (e.g., the value of the stays that got “stayed” in February, these are revenues that were booked and earned)
- and the expected revenues of the new bookings made in the same month (i.e., the new bookings recorded in February for any time, such as last-minute bookings in February, stays in August, or even next year)
There is an element of seasonality: In Europe and the US, there are more “stayed” stays in the summer months than new bookings. To notice differences, the data was indexed to the average for full-year 2019, which allows you to see the seasonal patterns in levels. For instance, in 2020, you can notice the build-up in new bookings in May/June as the U.S. and Europe came out of lock-down to the eventual stays in July and August. You can then see the gradual deterioration in demand through the fall and winter and the pick back up in bookings in January & February.
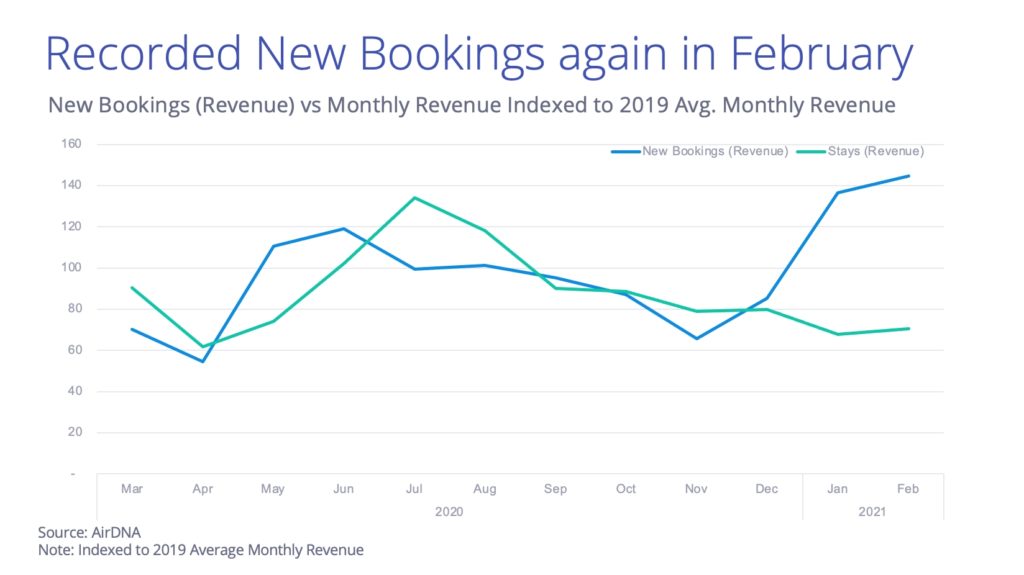
US: Monthly value of new bookings vs monthly value of stays (indexed to 2019)

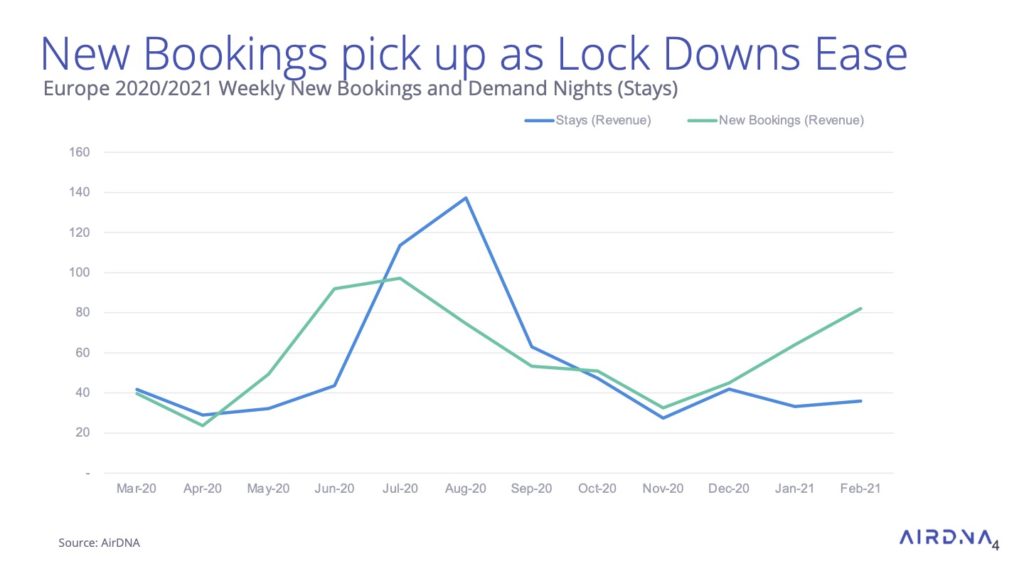
Europe: Monthly value of new bookings vs monthly value of stays (indexed to 2019)

In February 2021, the two graphs show a positive outlook for the future, as new bookings are rising above current stays. In the US, the gap is much wider, meaning that while the value of stays earned in February was terrible, the value of new bookings recorded in the same month was amazing.
February in the U.S. is at its highest level, while February new bookings in Europe are still below that of the peak that was reached in June.
In detail, revenues recorded at US vacation rentals were dismal in February 2021, at -30% compared to the same time in 2019 (pre-pandemic). Yet, the same number was even worse in Europe, at around -40%.
The performance comparison between the two continents gets even worse when looking at new bookings logged in February: In the US, bookings for spring and summer 2021 are so high that the new bookings logged’s value was 40% higher than in 2019. Meanwhile, in Europe, expected revenues from new February bookings were at -20% compared with 2019 figures.
So, we see a gap in both graphs, but we are talking about an avalanche of new bookings in the US, while Europe’s number stayed depressed compared with 2019 levels.
Differences in risk-taking, vaccine rollout, and economic stimulus
Yet, looking at a US vs. Europe comparison of vacation rental trends can yield compelling differences. The reasons for this very different performance are numerous. For instance:
- On average, European governments and populations have been more risk-averse than US states such as Florida and Tennessee, for instance.
- Covid-19 vaccine rollout campaigns have been faster in the United States than in the European Union.
- Some European countries are restarting lockdowns (e.g., Italy), while a lot of US states are buzzing with stories of reopenings.
- The new US administration is pushing through a $1.9 trillion stimulus package, while the EU has nothing similar to show for 2021 so far.
The UK shows that pent-up demand can be released all of sudden and change trends drastically
In Europe, we can expect demand to start rising when people will have more certainty about when travel restrictions, lockdowns, and curfews will end. For countries under strict lockdowns, the change in booking patterns can be sudden. As the UK has shown, all it can take is a government press conference sharing clear timelines about when people will travel again. Traffic on the websites of property management companies such as Sykes skyrocketed. In countries with milder lockdowns, it could be a gradual improvement as confidence returns.


