
Three things in your 2026 numbers will not behave the same way in 2027, and all three land in the targets being set this month.
- What changed: Easter moves from April to March in 2027, so Q1 will look stronger and Q2 weaker than in 2026. And if you are in a United States World Cup host city, your June and July 2026 prices were unusually high (+28% and +13% on 2025). They will not repeat.
- Who it affects: Property managers with 50 or more listings setting 2027 revenue goals, especially those using one number for several markets.
- What to watch: Compare March and April together, not month by month. And in host cities, expect June and July prices to drift back toward 2025.
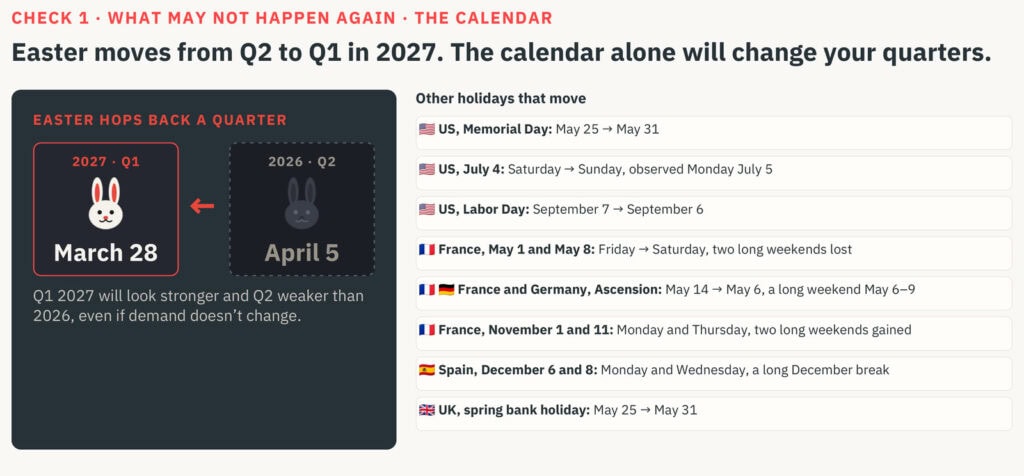
In 2027, Easter falls on 28 March. In 2026, it fell on 5 April. So if you compare Q1 2027 with Q1 2026, 2027 will look stronger, and Q2 weaker, even if demand has not changed at all. If you manage 50 or more listings, that is already in the plan you are writing now.
Richie Khandelwal, co-founder of PriceLabs, and Thibault Masson, founder of RSU by PriceLabs, used PriceLabs market data from the United States and Europe to show what drove 2026, and what will not repeat.
The usual way to set next year’s target is to take what you earned this year and add a percentage to it. They suggested a different starting point: start with 2026 as it happened, subtract the parts that will not repeat, then add the growth you plan to create. Three checks come out of that.
Check 1: Subtract What Will Not Happen Again
Some of your 2026 was the calendar, some was the weather, and some was an event that will not come back. Each one needs to come out of the base before you add growth to it.

- The calendar. Easter moving to March is the biggest change, and Thibault noted that March is already pacing well across several countries, which is the change showing up in current booking data rather than in a forecast. Eight other holidays move date or weekday in 2027, including Memorial Day, the UK spring bank holiday and two French May long weekends that disappear into Saturdays. We will cover the full list in a separate piece next week.
- The one-off event. In United States World Cup host cities, price per night rose 28% in June and 13% in July against the same months in 2025, while occupancy fell. If your market hosted games, those two months are probably the wrong base for 2027, because prices should ease and the regular guests who stayed away may come back. Our World Cup market data breaks down how the knockout rounds behaved differently from the group stage, and the demand by host city shows how differently each market responded.
- The weather. Repeated heat may be shifting when European guests travel, with June growing and August flat across southern Europe, and with French bookings moving north in 2026 while the Mediterranean coast grew slowly. Its own piece, next week.
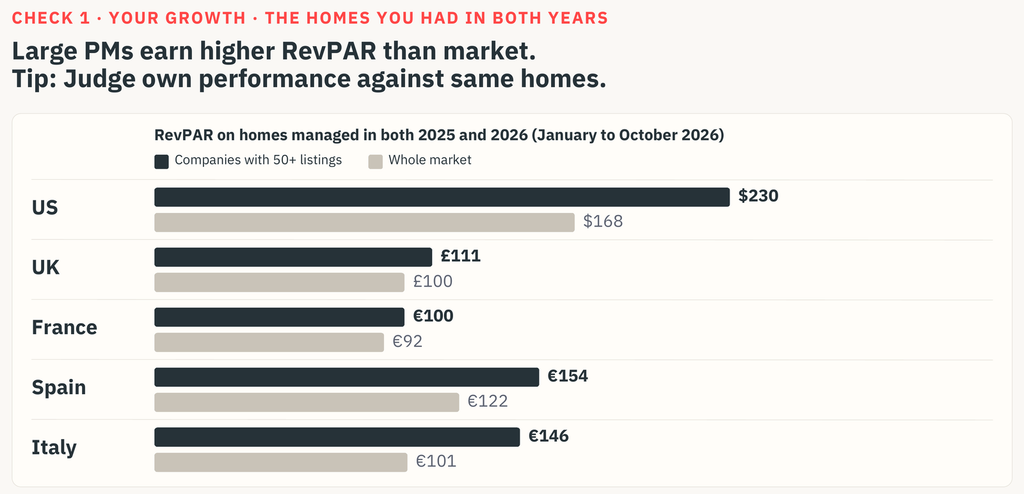
- Your own growth. Your portfolio total includes homes that joined you during the year, so only the homes you held across both years show how well the business was run. Also its own piece, next week.
In PriceLabs: Define the Market First, Then Put Your 2026 Next to It
Richie built the comparison live. In the Market Dashboard, select the listings you want, then narrow: one bedroom, above 4.5 stars, more than 100 reviews. Generate the comp set, and every chart in the dashboard refreshes against it. One dashboard holds several comp sets, so each market or home type gets its own, and if narrowing leaves too few homes, go back a step. Our guide to building a comp set covers the full sequence.
Report Builder then puts your occupancy, ADR and RevPAR next to that comp set in one report. To isolate the homes you held across both years, filter by first sync date before 1 January 2025. The checks themselves work in any BI tool or spreadsheet, which is how Richie framed it on the call.
Check 2: Set the Goal Where You Will Track It
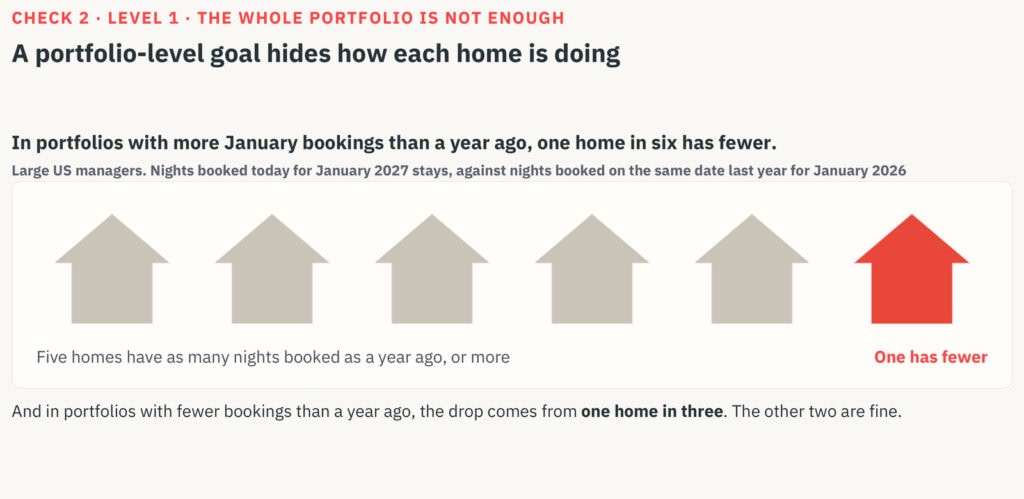
A single portfolio number hides the homes slipping underneath it.
- In portfolios booking ahead of last year for January 2027, one home in six has fewer nights on the books than at the same point a year ago.
- In portfolios booking behind, the shortfall comes from one home in three. The other two are performing normally.
- Where the room sets its goals, from a live poll during the session: 37% per listing or per owner, 35% by market, region or group of homes, 14% one overall portfolio number, 14% no formal goal yet. Small, self-selected sample, so read it as a snapshot of one room rather than an industry measure.
One definition is worth settling before any of this. A goal is what you set in advance for a year or a period. A forecast is what you refresh as bookings arrive. Richie was direct that a forecast is not a goal, which is why the goal tool deliberately does not let you set a target from the PriceLabs forecast.
In PriceLabs: Set Goals in Report Builder, Then Track Against Them
Manage Goals sits inside Report Builder, in Portfolio Analytics, and Richie set one up live. You can build the goal from last year’s performance plus an offset, which suits a home you held all year. Or you can pull a Market Dashboard comp set and let it propose the annual number and how it spreads across months, which suits a home you took on recently. Either way you adjust before applying: if Easter moved your strong month from April to March, bump March up.
Then build the tracking report. Richie had one saved as Goal Tracking, set at month level, pulling rental revenue against the goal so the gap is visible as the year runs. Goals can be set at listing, group or portfolio level, and against revenue, ADR, occupancy or RevPAR. Our guide to vacation rental revenue reports covers which metrics belong in one.
His practical advice was to set them at listing level, then discount when you add them up. Some listings will miss, so sum the listing goals for a group and take roughly 10% off the total. He also flagged that these screens get a significant upgrade in early 2027, with adjustments for events, seasonality and calendar blocks handled automatically.
Check 3: Judge Peaks and Quiet Weeks by What They Earned
Peak dates and quiet weeks have the same test: what they earned, not how full they were.
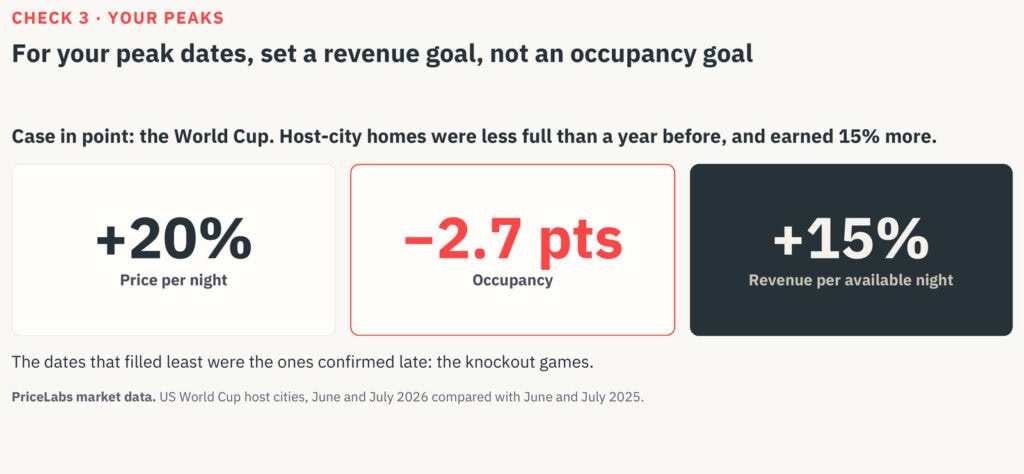
- Peaks: the World Cup. Across June and July, host-city homes took 20% more per night, lost 2.7 points of occupancy, and earned 15% more per available night. Scored on occupancy that was a failure. Scored on revenue it was a strong peak.
- The dates that filled least were the knockout games, which were confirmed late. A peak whose details land late needs a review date set in advance, not a price set once in November.
- Quiet weeks: Florida in September. 10% more nights per home at a 1% lower price, and 8% more per available night. Filling the week paid.
- Quiet weeks: Florida in October. 7% more nights at a 6% lower price, and exactly 0% more per available night. Extra nights at lower prices can add nothing at all.
September and October are Florida’s slow months, with no event involved, and both filled better in 2026 than in 2025. Only one of them earned more for it.
Most of the room already works this way. Asked in a live poll how they judge whether a peak date went well, 67% of those who answered said by what it earned, 21% by whether it hit their rate, and 12% by whether it sold out. Our read is that occupancy is still the language much of the industry uses for peaks, and this room has mostly stopped thinking that way. We have written before about where vacation rental revenue management shifted toward RevPAR.
In PriceLabs: Find Your Peaks and Quiet Weeks in Report Builder
Richie showed the shortcut for this. Report Builder has a ready-made template called historical event performance analysis. Open it and you get last year’s dates with occupancy, ADR and the event names attached, plus the event names from the year before so you can compare like with like.
To find your peaks, sort by ADR descending and read off the top dates. For quiet weeks, switch the header row from days to weeks and look at the bottom. Then write the rule for each date, and let date-specific overrides and minimum stays hold it.
The Owner Whose Home Sat Empty Does Not Care About Your Average
A portfolio can earn 15% more per available night and still contain a home that sat empty at a high price. That owner will ask about it in January, and by then, you are explaining, not planning. Agree how a peak will be judged before the peak.
The work itself is short: ten best dates, ten quietest weeks, one rule each, agreed with the owner before the date arrives. If you are sharing any of this with owners, our guide to owner and internal reports covers running both from one set of numbers.
Richie closed the session on a point worth repeating. In his experience, precision matters less than having a number you can track against, and the managers who get granular tend to do better than the ones who chase an exact figure.
Easter has moved. Check your 2026 numbers before they set your 2027 targets.

Guneet has spent five years working at PriceLabs, developing deep expertise in short-term rental operations and hospitality technology. She brings that practitioner’s lens to her writing at RSU, covering platform updates and making sense of market data for property managers.
Related Articles:
 New PriceLabs–Booking.com Integration Helps Hosts Gain Back Pricing Control
 From Empty Gaps to Extra Bookings: PriceLabs’ Dynamic Min Stay Tackles Lost Revenue
 PriceLabs Hits 161 Integrations, HomeToGo Snaps Interhome, Booking.com Debuts Rewards Card
 Before You Slash Rates: 4 Steps to Protect Shoulder Season Revenue