Airbnb financial results
So, Airbnb has just had its best. Q3. ever. (as expected). We’ll look into the highlights of the company’s third-quarter financial results to see why, despite selling fewer nights in summer 2021, Airbnb’s revenues, margins, and net income slay the pre-pandemic 2019 numbers. We’ll see whether Airbnb has won its bets, looking at the company’s data and statements with a grain of salt. For instance, if long stays have progressed as a share of booked nights, they actually seem to be plateauing to 2020 levels in absolute room night number (according to our calculations). Active listings are up by 15% in non-urban destinations compared with Q1 2021, but how many of them were actually already on the side but left dormant by their hosts last winter? Property managers know how seasonality alone can impact active listing numbers.
Yet, the push by Airbnb’s product marketing and program management teams to get key product features adopted (e.g. monthly stay discounts) and creative programs scaled up (e.g. Ask a Superhost) is the seed for future revenue growth.
First, let’s get the picture: Airbnb’s third-quarter financial data
As usual, when looking at 2021 financial data, the comparison year is 2019, not 2020. The 2020 data is so bad that almost any type of business performance in 2021 looks better.
This is why it is fair to say that Airbnb’s data is striking: Q3 2021 was its better quarter ever (better than 2019) in terms of revenues, adjusted EBITDA, and net income.
Was it expected that Q3 would be so good for the Airbnb platform?
Yes, it was.
- Factor 1: Seasonality. Q3 is always Airbnb’s best quarter of the year, as it is for Vrbo and Booking.com. Why? Because most of their users are based in the Northern Hemisphere (e.g. North America, Europe, Japan). Q3 months (June, July, and August) are periods for long vacations and international travel.
- Factor 2: Q2 data showed the way. Another side of seasonality is that a lot of people book their trip in Q2 and actually stay in Q3. It means that some Q2 booked nights become Q3 revenues. As Q2 room nights were high, we could expect Q3 revenues to be decent. In 2021, COVID may have amplified the phenomenon: In many countries, restrictions were still in place in Q2, so people were searching and booking for trips in Q3 (especially July and August) with revenge.
- Factor 3: Since 2018, Q3 has been the only quarter of the year when Airbnb does not record a net loss. In other words, it was expected that not only revenues but also Adjusted EBITDA and net income would do well: “Q3 net income of $834 million was our most profitable quarter ever, nearly 4x larger than a year ago.”.
What’s impressive is the improvement in terms of margins: EBITDA margin was 49% for Q3 2021, compared with 19% in 2019. Several factors can explain this improvement:
- Higher revenues: Slightly fewer nights sold than in 2019, but at a much higher price. While room nights were still at -7% compared to Q3 2019, ADR more than made up for it, with a jump of +33% compared to Q3 2019.
ADR is still much higher than in 2019 but is going down
- In 2019, Airbnb’s ADR was around $112-$122.
- In 2020, Airbnb’s ADR was between $114 and $130.
- In 2021: Q1 2021 averaged at $160, Q2 2021 at $161, and Q3 2021 at $149.
The reason for the increased ADR in 2021:
- Proportionately more bookings in areas with higher ADRs (e.g. the US) than lower (e.g. Asia). Europe has lower ADRs than the US. As Europe bookings increased in Q3, the overall ADR went down from the winter and spring of 2021 when US bookings dominated.
- Proportionately more bookings for entire homes, which are more expensive than shared spaces.
- Proportionately more bookings in non-urban destinations (e.g. seaside) which tend to be more expensive.
Note that, as urban destinations, are picking up, the ADR should continue going down. Same thing if people start booking shared spaces again.
- Lower costs: While Airbnb has started spending money on advertising again (i.e. Made possible by hosts TV campaign), the marketing spend per dollar earned is still lower than in 2019. Brian Chesky said that more than 90% of Airbnb’s traffic was free or unpaid in Q3. Note that, after shedding 25% of its workforce in 2020, Airbnb’s staffings costs also remain lower in proportion than in 2020 and 2019.
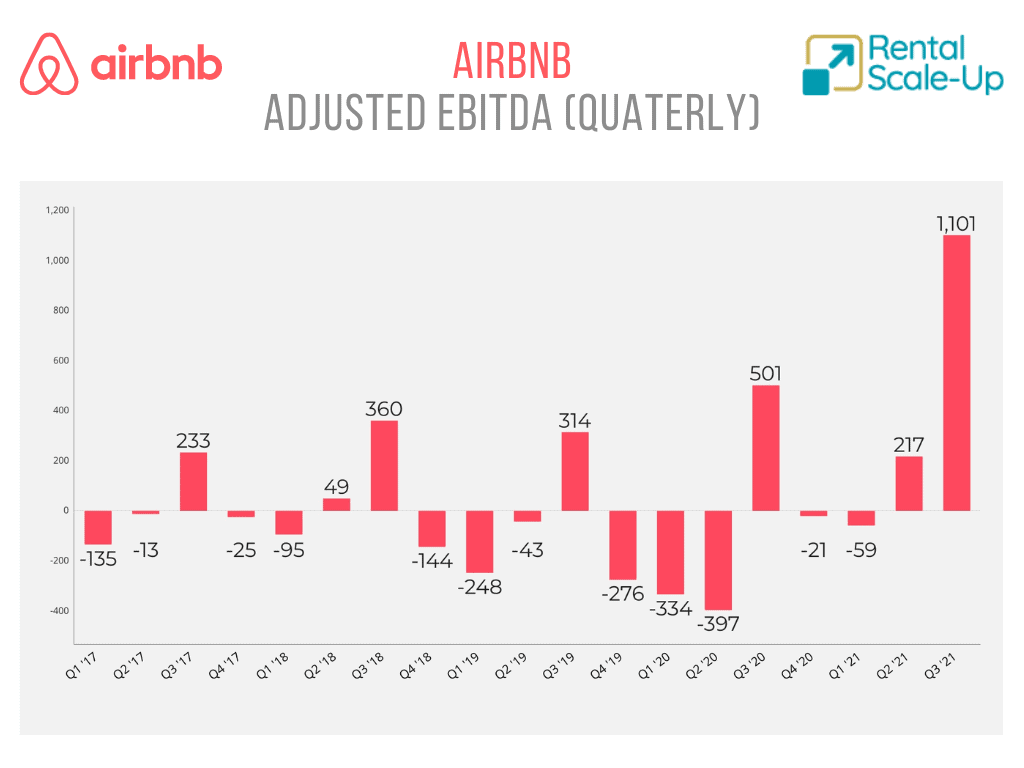
We’ve created the graph below to show that Airbnbb’s Q3 2021 Adjusted EBITDA is impressive. It makes up for the negative numbers of Q4 2019, Q1 2020, and Q2 2020 combined. The graph also shows how seasonal Airbnb’s business remains, as Q3 is really the quarter where Airbnb makes some / any money.

From “Belong Anywhere” to “Live Anywhere”: A revolution or a moment in time?
Brian Chesky said:
“The third quarter was Airbnb’s best quarter yet. The pandemic has led to a revolution in how we live, work and travel and we’re constantly innovating to meet this new way of traveling and living.”
The CEOs of Expedia and Booking.com are more measured: They see 2020 and 2021 as a moment in time where vacation rentals boomed and hotels crashed, while 2021 should see hotel numbers get much better. So, is 2021 a special moment in time, where stars aligned for the likes of Vrbo and Airbnb?
Some trends seem to be here to stay, such as remote working. A lot of people have discovered vacation rentals and are now aware that Airbnb offers some. Airbnb has been busy making sure it increased its non-urban supply and it talked up its long stay offering.
Airbnb’s pre-COVID use case: A couple booking an apartment in a big city, in the US or in Europe. To paraphrase Airbnb’s CFO, the company’s playbook was more urban and more “crossborder” (i.e. international travel) than now.
- Pre-pandemic:
- Urban = 60% of Airbnb’s business
- Cross-border = 50% of Airbnb’s business
- Q3 2021:
- Urban = 46% of Airbnb’s business
- Cross-border = 33% of Airbnb’s business
We look at these data in two ways:
- Positive: Airbnb has managed to record its best quarter ever, while its traditional engines, international travel and urban destinations, were still running slow.
- More measured: As cities reopen, the part of Airbnb linked to urban destinations will go over 50% again. Despite what its commercials are showing (e.g. tree houses, seaside vacation rentals, and wood cabins), condos and apartments will probably remain Airbnb’s most sold property types. Just as with Booking.com and unlike Vrbo.
The return of international travel in Q4 2021 should help Airbnb’s fortunes, even if lower temperatures in the Northern hemisphere may lead to new COVID waves. Airbnb shared that, during the week following the October 15 announcement of the November 8 reopening of US borders to Europeans, nights booked by foreign guests for US stays starting November 8 increased by 44%.
Bet #1: Can Airbnb generate bookings in non-urban markets?
Yes.
Driven by where the demand was turning to and by an effort to get more of this supply, gross nights booked to rural destinations increased more than 40% in Q3 2021 from Q3 2019.
Bet #2: Can Airbnb grow the number of long-stay nights sold?
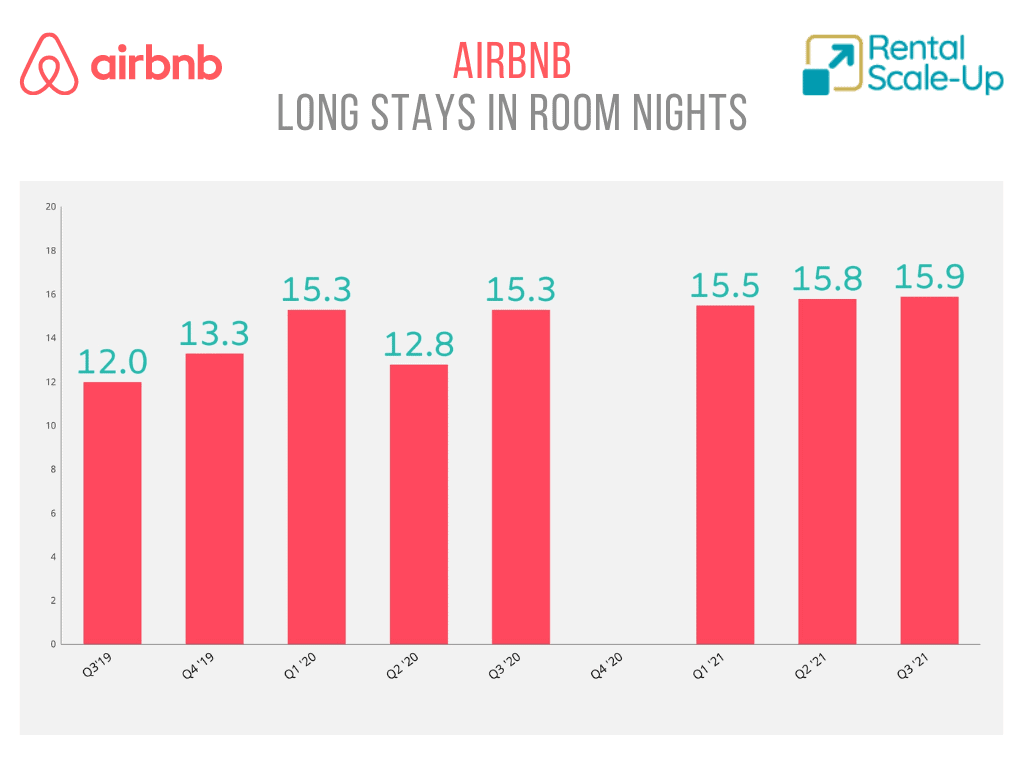
Adoption by hosts is high, but room nights seem to be plateauing at Q1 2020 levels. Long stay revenues are growing in share, but not in room nights.
Airbnb claims that:
Long-term stays of 28 days or more remained our fastest-growing category by trip length and accounted for 20% of gross nights booked in Q3 2021, up from 14% in Q3 2019.
So, the share of long stays has jumped from 14% to 20% of gross nights booked, from 2019 to 2021. But how impressive is that in terms of room nights?
First, let’s note that, in Q1 2021, the share of long stays was 24% of booked nights. It makes sense that the share would drop as more normal travel patterns returned for the summer and the share of short stays would grow back. Fair enough.
Second, as we did when discussing Airbnb’s long stay data, let’s compare absolute room nights numbers:
- Q3 2019: 14% of 85.9 M = 12.0 M (estimated)
- Q3 2021: 20% of 79.7 M = 15.9 M (estimated)
Compared with Q3, this is a +25% growth in room nights. Quite impressive.
Yet, Rental Scale-Up looked back at the long-stay data that Airbnb has shared.
If we add Q3 2020, we can see something interesting:
- Q3 2020: 15.3M (Source: Airbnb S-1)
Over the last two years, in terms of room nights, the growth is less impressive.

Another claim about the adoption of monthly stays among hosts is interesting to examine:
“More than 90% of active listings now accept long-term stays, and the number of active listings that offer the monthly discount is up 20% from Q3 2019.”
A 90% adoption rate, in terms of product marketing, is simply astounding. Now, the rate was already 80% in April 2020, as we looked up in a previous Airbnb press release.
The same April 2020 said that “about half of the company’s active listings now provide discounts for stays of one month or longer.” If “the number of active listings that offer the monthly discount is up 20% from Q3 2019”, we can estimate that around 60% of Airbnb listings offer a monthly discount. Again, this is a very impressive number for a platform that started out as a short-stay provider.
Bet #3 Can Airbnb attract new supply?
Airbnb is trying to. Its number of active listings is growing again, but some of them are probably listings that were snoozed by their hosts during the worst of the crisis. Yet, programs such as Ask a Superhost can bring in actually new and productive listings.
1/ Ask a Superhost program:
The Ask a Superhost is an extension of the Airbnb Ambassador program. During the 2021 Winter Release, it was announced that it was now active in over 30 languages in 196 countries. Prospective Hosts are paired with Superhosts based on their location, language, and listing. To date, more than 60,000 prospective Hosts have used Ask a Superhost.
Superhosts get a big financial reward when their mentee get their first booking. The speed to the first booking is then a key success metric of the program. Here’s what Brian Chesky shared about it:
50% of new listings receiving a booking in three days,75% of new listings receiving a booking within eight days.
2/ Increase in active listings
Active listings in non-urban Europe and North America increased almost 15% from Q1 2021 to Q3 2021. This is key for Airbnb, as it wants to show that it can grow its supply outside of urban markets.
Note that “active” does not necessarily mean new. It means that they are bookable. Some hosts may have just reactivated dormant listings and opened up their calendar to new reservations.
It is interesting to note that Airbnb mentions increases in North America, EMEA, and Latin America. But not in Asia. Financial analysts have not asked what is happening to Airbnb China (Aibiying), on which the company founded great expectations pre-COVID. The local strategy was to attract outbound Chinese travelers and inbound international guests. Chinese travelers have not been traveling abroad and foreigners have not been able to go to China for almost 2 years. Yet, domestic Chinese travel has boomed. How has Airbnb fared?
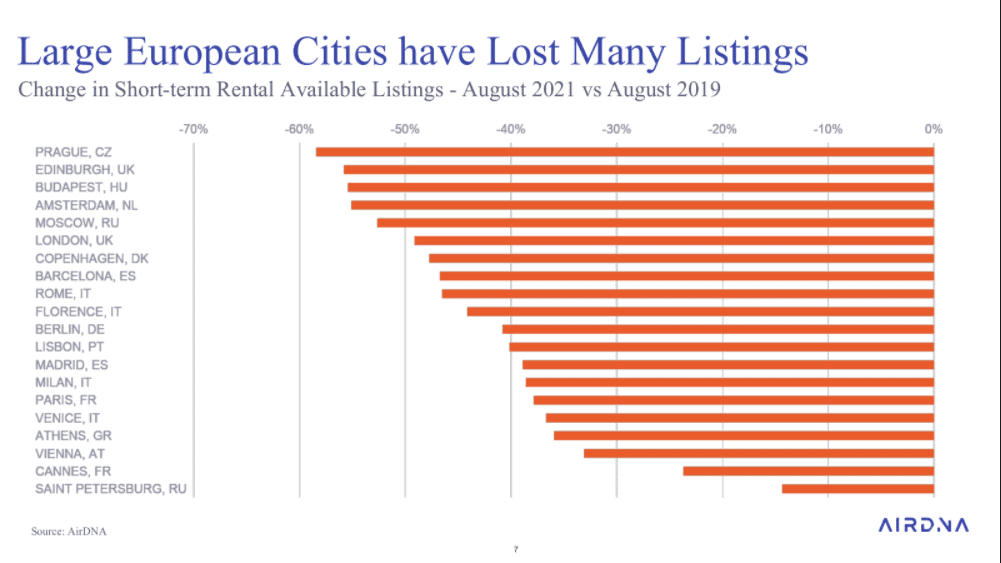
Another key issue is urban supply. For the moment, there is more than enough supply for the low demand in the US and especially in Europe. Yet, some listings may be hard to reactivate: The combination of a long drought of international travelers and of new short-term rental regulations has impacted negatively the numbers of Airbnb listings in key cities, as illustrated by this AirDNA graph:

2022 financial results will tell.


