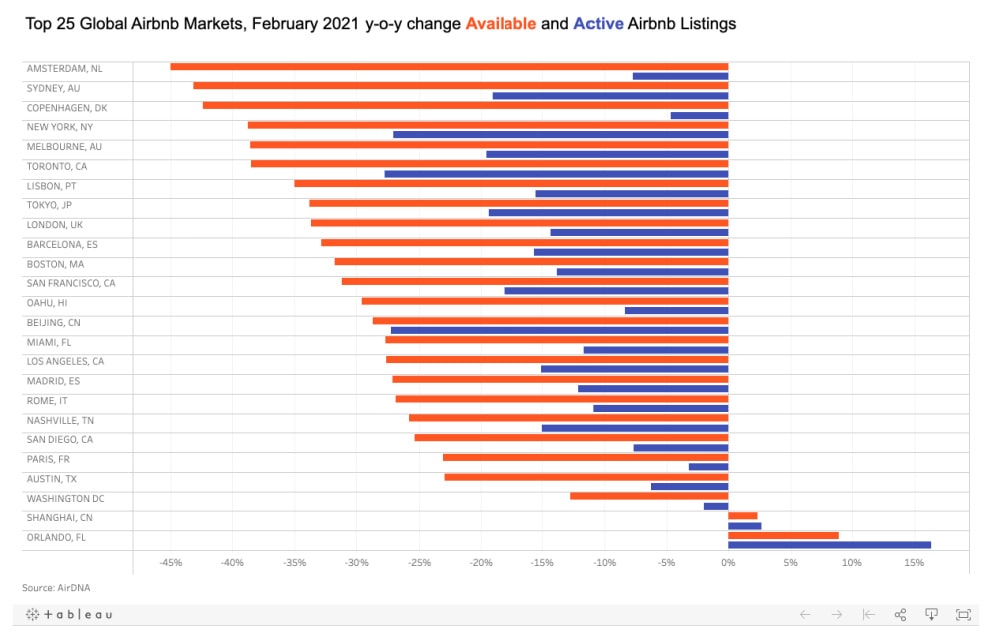
For more than a year now, the COVID-19 pandemic has altered demand patterns across most of the world’s short-term rental markets. For instance, sea, rural, and mountain markets fared well in North America and Europe in summer 2020, while travelers avoided urban short-term rentals. How about the supply side? How much has this change in demand impacted the number of active listings on Airbnb? In markets such as Toronto, Amsterdam, or New York, where available listings have dropped by more than 35%, how permanent are these changes?
AirDNA, a leading short-term rental data provider, has released an in-depth analysis that gives some striking hints about the impact COVID-19 has had on global Airbnb supply.
After sharing with you some gems from this AirDNA report, we’ll look at several considerations and warnings about reading too much in supply graphs. This way, you will be able to look at AirDNA’s data and think for yourself about what they actually mean in the short-term rental markets that you know. Combining great data tools with on-the-ground experience is the way for savvy property managers to interpret market trends and take appropriate actions to adapt.
Most striking data from AirDNA’s report about the evolution of Airbnb’s supply numbers
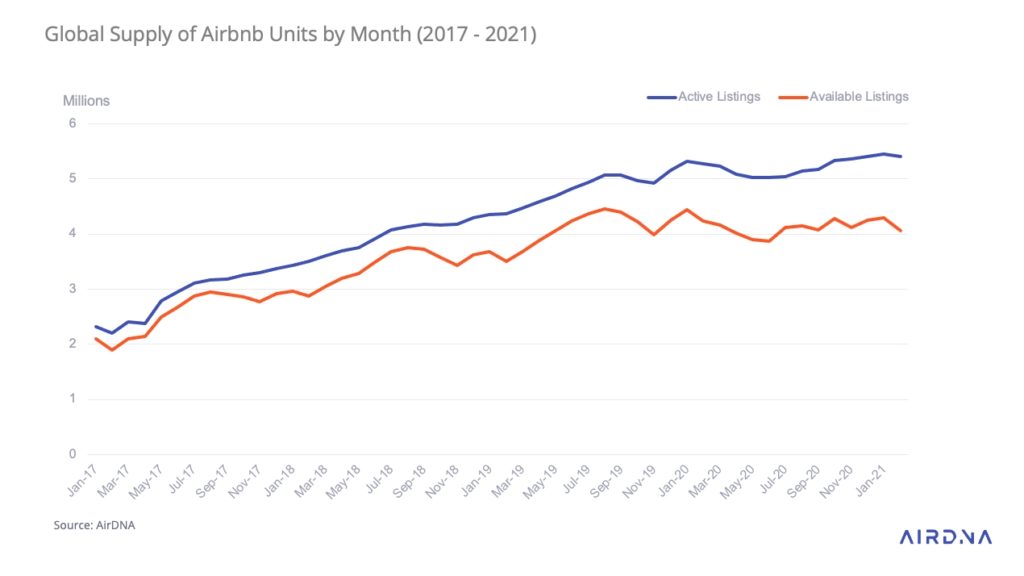
Number of active listings has recovered, but gap with number of actually available listings has widened: Are hosts keeping listings closed in the absence of demand?

As the AirDNA report clearly explains, the data is based on Airbnb listings that were found to be either active or available in February 2021:
- Active Listings: Number of listings viewable on Airbnb with at least one prior booked night.
- Available Listings: Number of active listings that have calendar availability or at least one booked day in the month.
Let’s have a look at key data:
- Globally, there are more than 5.4 million active listings on Airbnb. Airbnb’s supply has more than doubled over the past four years, up from just 2.3 million at the beginning of 2017.
- From January through June 2020, Airbnb lost 5% of its total listings but has since bounced back with a growth of 2.5% off pre-pandemic levels.
Major drops in available listings in big cities. But cities with a drop in ACTIVE listings are the ones where supply seems to have shrunk for the medium to long term

- As we will see below, it is technically easy to temporarily close the availability of a listing and then switch it back on with just a few clicks. A listing that is not available can be dormant. Yet, a listing that is not active is closer to churning, a sign signs that the property is leaving Airbnb or even leaving the short-term rental industry.
- Drops in active listings have been bigger in cities than in other markets, for instance in Canada. Collectively, Toronto, Montreal, and Vancouver have lost 22% of their active supply over the past year compared to a decline of just 3.5% throughout Canada.
- Cities like Amsterdam, Copenhagen, and Oahu, are likely to see faster rebounds in supply due to relatively low changes in active listings. Amsterdam is also a case where local regulations impact the number of listings: In 2020, the city of Amsterdam banned short-term rentals for its center, but this ban has just been overturned. Property owners may have made their listings unavailable while waiting for the legal battle to end, which compounded the pandemic’s effect on the number of available listings.
- Markets like New York, Toronto, and Beijing all have significant declines in active and available listings, suggesting that these declines are more likely to be permanent.
Some markets are in high demand, but cannot add supply

- The striking difference can be seen at a market level. An absence of demand in urban centers and global cities has pushed Airbnb hosts to stop renting their properties temporarily or remove them from the platform entirely.
- Airbnb’s supply continues to diversify away from urban areas in the US, which made up 40% of supply in 2016 to just 20% in 2021.
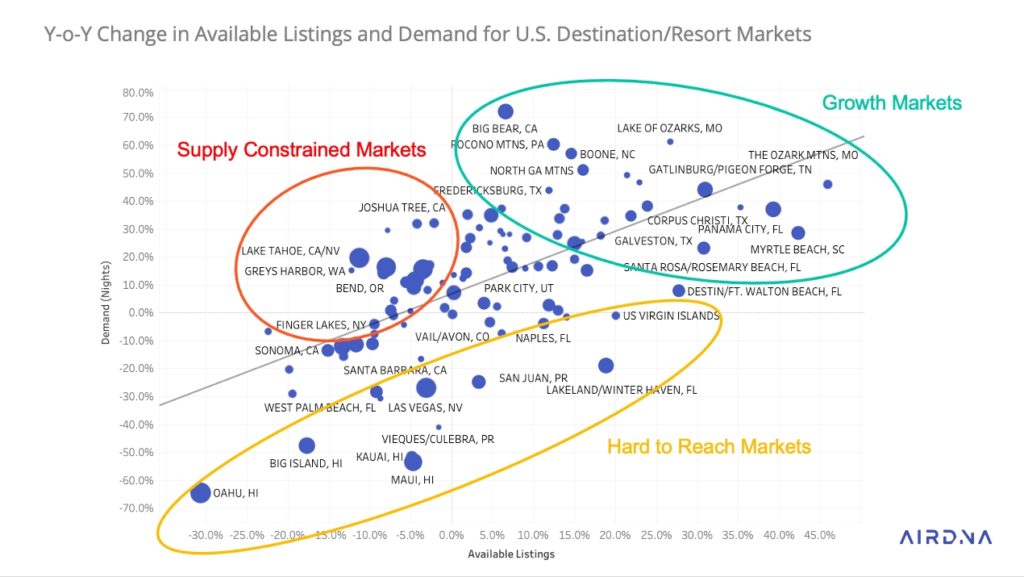
- Supply constrained markets: Some markets are in high demand, but supply cannot grow or is shrinking, as some properties are occupied by their owners who have chosen to work remotely from there and as other listings have been converting into long-term housing. This is the case in California, where tech employees have left San Francisco to spend time in Joshua Tree and Lake Tahoe.
- Hard to reach markets: These are markets with a lot of vacation rentals and that are usually reached by planes (e.g., Hawaii, US Virgin Islands). The supply cannot easily move to other purposes, such as housing. So, a lot of owners and managers have closed the properties until demand comes back.
- Growth markets (e.g., Tennessee and the Carolinas) have recorded higher demand than in February 2020, but they also have a bit more availability.
- Markets that remained attractive to guests throughout the pandemic, such as Myrtle Beach, Tampa, Morehead City/Emerald Isle, and the U.S. Virgin Islands, all experienced significant gains since the start of the pandemic.
Considerations when looking at changes in Airbnb supply data
Supply can go down fast as it is easy to snooze a listing on Airbnb. So they can come back online in just a few clicks.
- People from outside of the short-term rental industry may think that a drop in active or available listings means that the property owners have left Airbnb for good. Actually, a listing can disappear and come back in just a few clicks.
- As property managers and owners know, it is easy to make a listing look inactive or unavailable on Airbnb (soft churn) without having to remove it from the platform (real churn):
- If you close your calendar, your listing is unavailable for the month. It takes a few clicks to do in the Airbnb Hosting dashboard or in the app.
- You can hide your listing for up to 6 months by using the snooze function on Airbnb. Just change the status of your listing to “snoozed” and you are done. The listing will come back online automatically after the period of time you indicated.
- You can also change the status of your Airbnb listing to “unlist“. To put it back online, you have to take action and change the status again on the “Manage Listings” page.
- Channel managers and PMSs have similar functions to hide or reactivate a listing in just a few clicks.
Supply: Growing of property managers over individual hosts?
According to AirDNA, operators with 21+ units increased their available unit counts by more than 14% over the past year, while available listings declined by 9% over the year for single property hosts.
A few hypotheses can come to mind:
- Demand has been the most affected in cities. Some hosts had built mini Airbnb empires, doing rental arbitrage at several properties and co-hosting a couple more. COVID-19 hurt these Airbnb entrepreneurs who may quit the industry. If demand comes back, Airbnb entrepreneurs and side-hustlers may gradually re-enter the market. Yet, some have been burnt in 2020 and remain hesitant.
- Property management companies are usually strong in traditional vacation rental markets (sea, mountain, and country). With the increase in demand, they may have added even more supply through relentless homeowner acquisition campaigns (see our article about how Vintory helps property managers grow their supply).
Airbnb wants to add more individual hosts, as they tend to more loyal or even exclusive to the platform. These hosts also tend to use more Airbnb tools, such as SmartPricing, which helps Airbnb get better conversion than when property managers get to set up their own pricing rules and restrictions. This is why Airbnb is doubling down on its Made Possible by Hosting campaign and on its Airbnb Ambassador program to find new supply powered by individual hosts.
Local regulations can influence supply data, short and long term
We’ve already talked about Amsterdam’s example, where a local ban on short-term rentals in the city center had compounded the effect of the pandemic on the number of AVAILABLE listings. Property owners were waiting for the return of demand and the outcome of the legal battle with the city to make a decision. The ban has been overturned, so some of these short-term rentals will likely become available when demand ramps up.
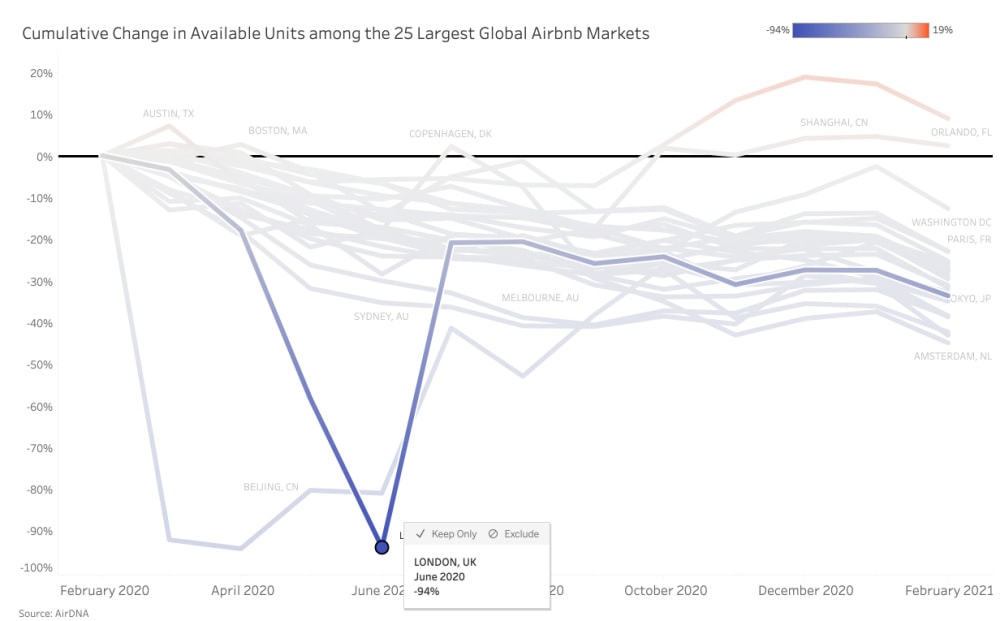
London is another example where regulations can dramatically influence the availability of listings. For instance, in June 2020, AirDNA reports that London’s number of available units had dropped by 94%. The reason is that the British government had been all short-term rental activity on its territory, under strict lockdown measures.

Demand can drive supply up, but how fast?
- Traditional vacation rental markets (sea, mountain, rural) have fared well in summer 2020, especially in regions with access to domestic markets that could support the absence of foreign travelers (e.g. US, UK, Netherlands, and France) .
- In 2020 and 2021, property managers have tried to add more supply in these areas. As summer 2021 is supposed to be similar to 2020, it would make sense to get more cabins, lodges, cottages, and villas available for booking.
- Yet, such properties are not built in a couple of weeks. The pool of additional properties can be limited. A lot of property managers are running homeowner acquisition campaigns in the same areas.
- One tactic is to get the owners of second homes to open their houses to guests. However, in 2021, a lot of owners are choosing to keep their properties for their own use as they are not sure that they could go somewhere else. In Lake Tahoe, for instance, property owners are themselves working remotely, leaving less supply from people who went to find an airbnb to do the same.


